Streamline processes and ideas with easy-to-use flowchart templates.


Use flowcharts to diagram complex processes, brainstorm ideas, or optimize current processes.
Here are a few reasons why teams love MindManager flowchart templates.
Express complex ideas in an easy-to-understand, visual format. Add GIFs, images, icons, documents, and more. A visual flowchart lets your business easily turn good ideas into actionable projects.
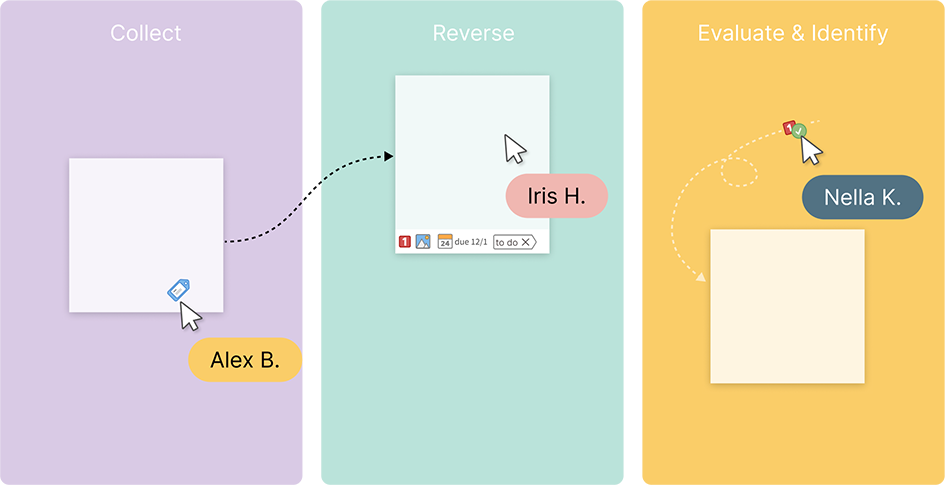
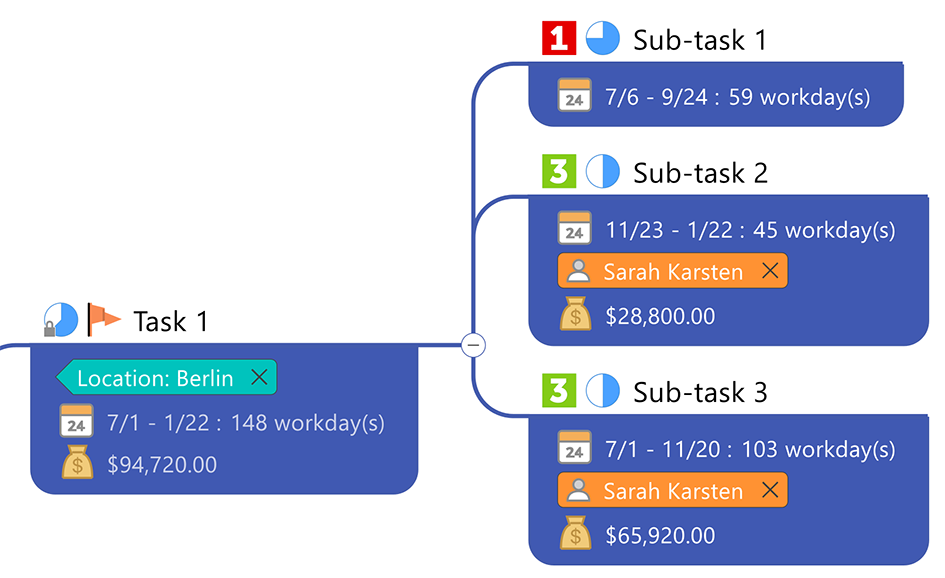
Tired of making plans that never see the light of day? MindManager flowcharts allow you to add tasks, set due dates, and tag team members for their input, making it easier to turn ideas into actionable steps.
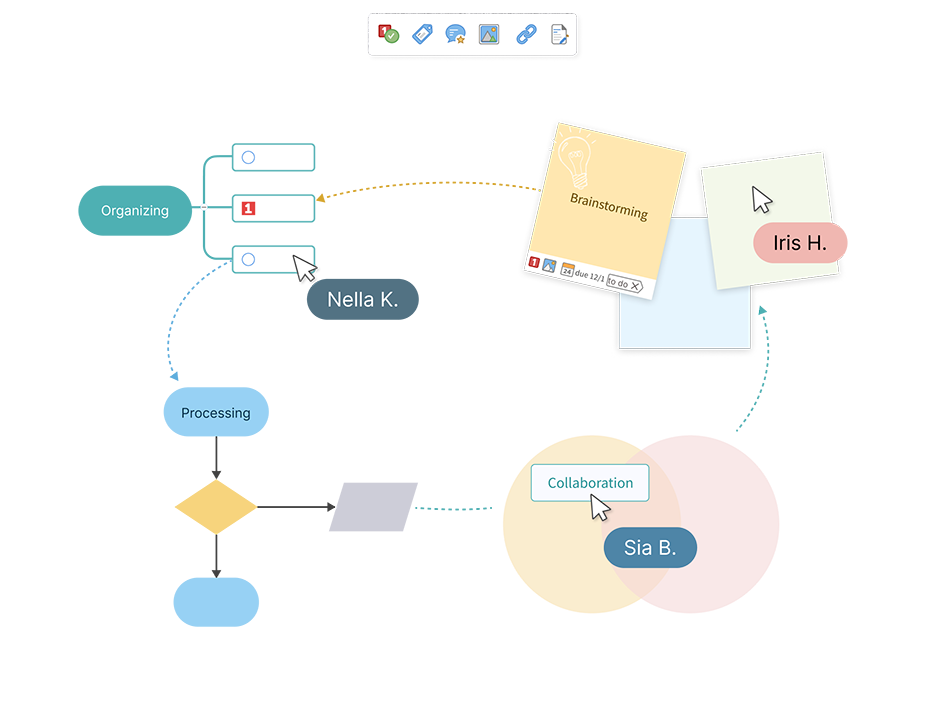
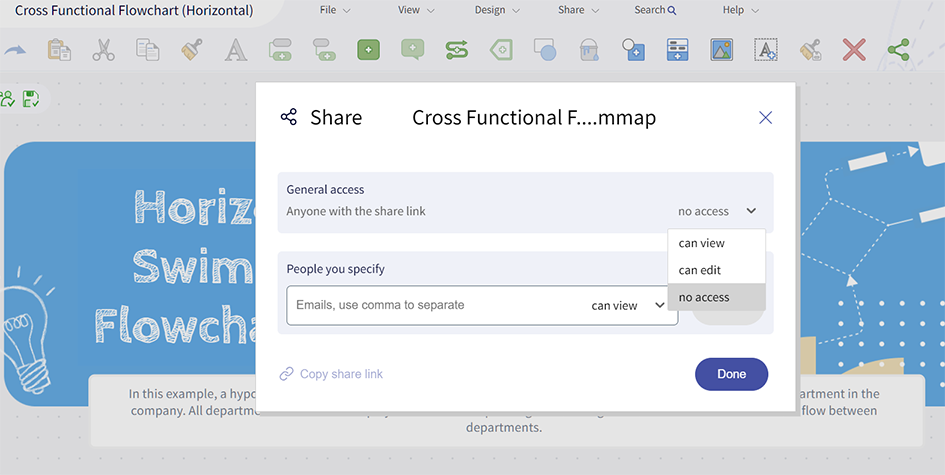
Reduce barriers to collaboration with customizable access. Allow users to view or edit documents, ensuring seamless collaboration across the office building — or around the world.
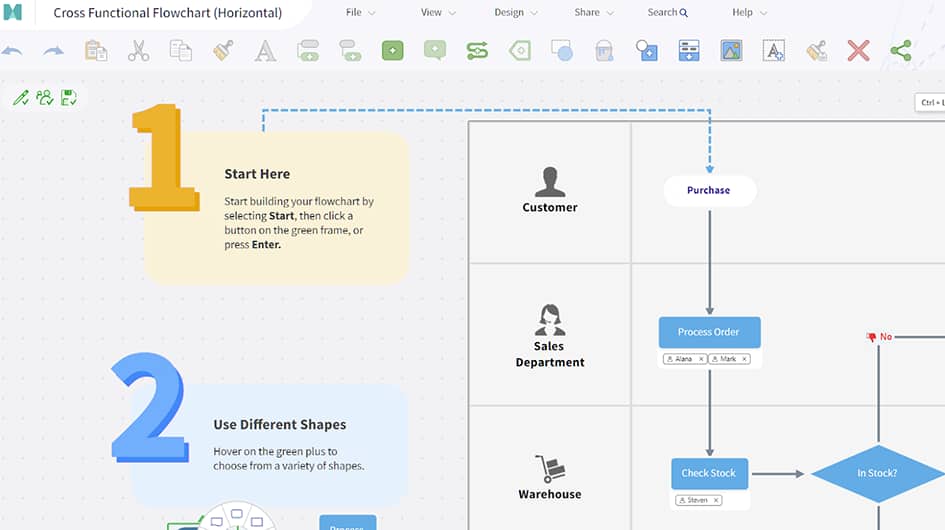
All you need to create a flowchart is an idea or process you want to map and a few clicks. Follow these steps to get started.
MindManager is recognized as a must-have tool to improve team efficiency.
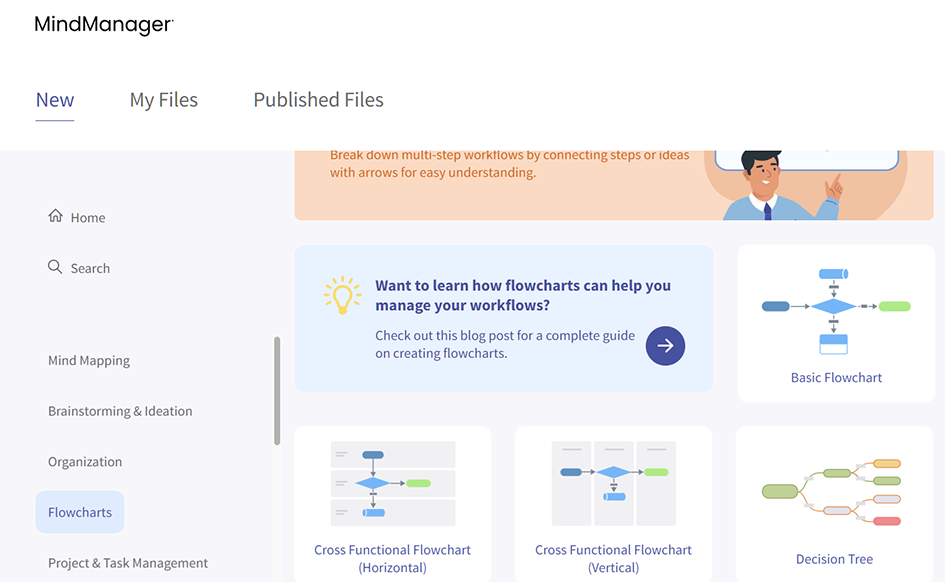
Flowchart templates serve as a starting point to turn ideas and processes into visual charts. Choose a template, label your steps, upload images, include notes, and share with your team. Here are three templates to create great-looking flowcharts in just a few clicks.
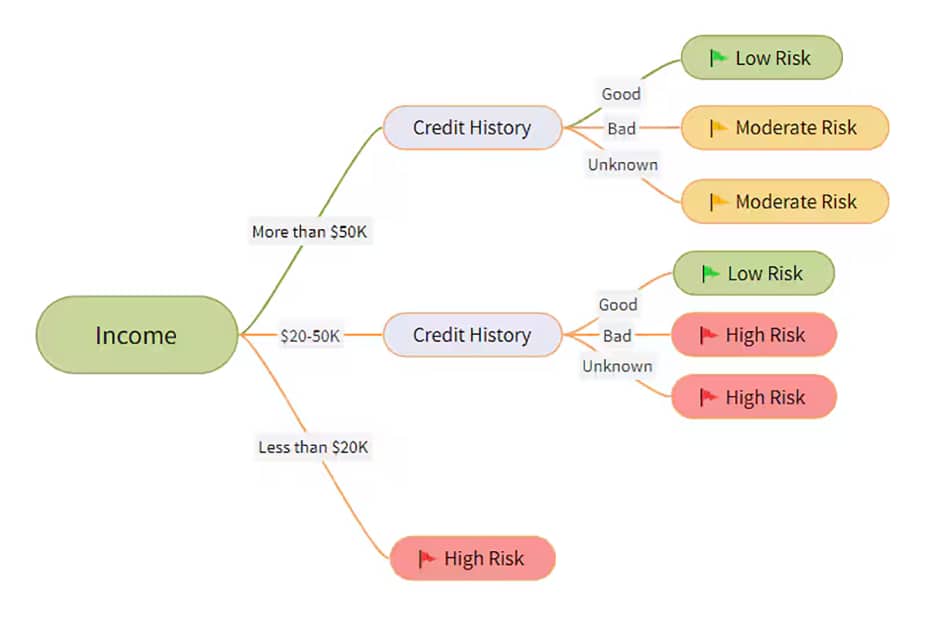
A decision tree is a visual map that shows two or more distinct decision pathways. It lays out the potential consequences of various solutions via a network of one-directional branches, demonstrates outcomes attached to a string of related choices, and assigns probability values to those outcomes.
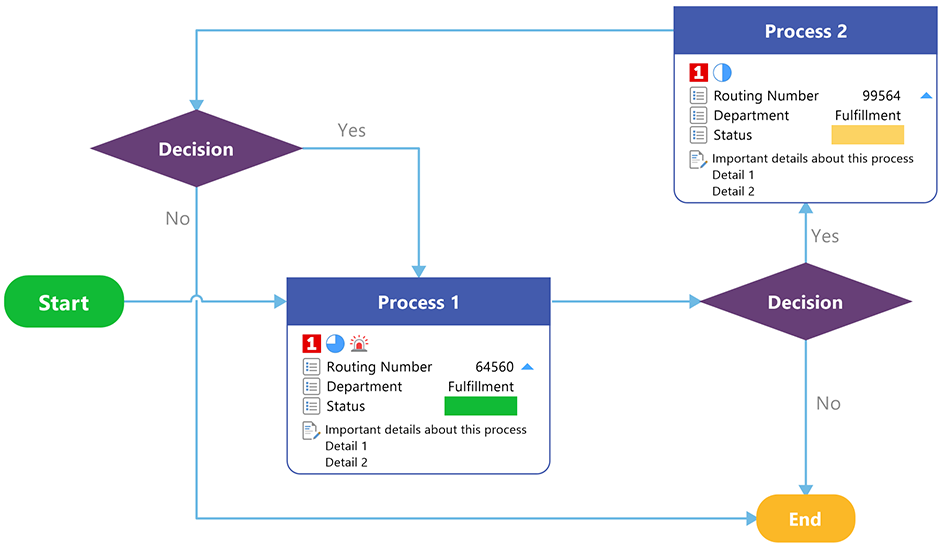
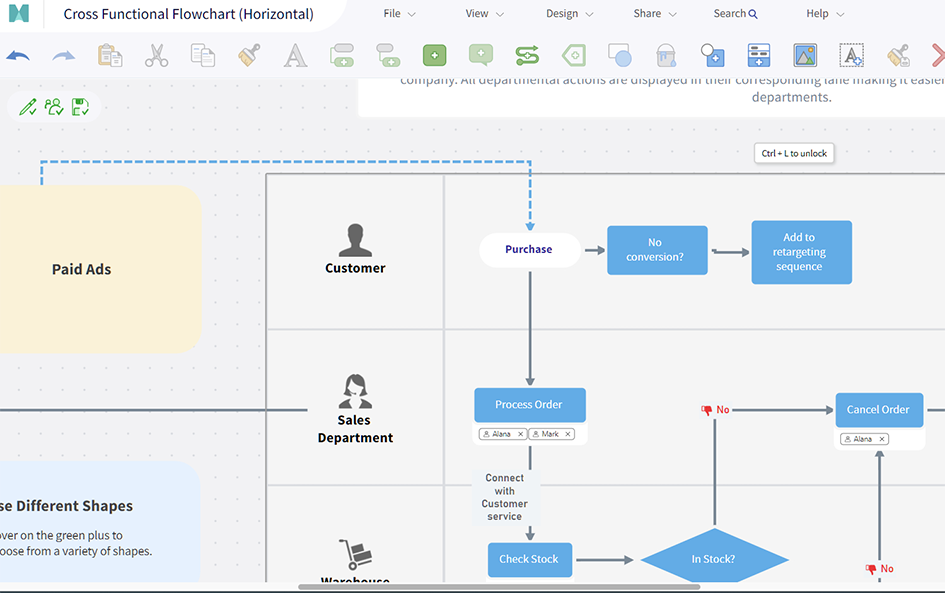
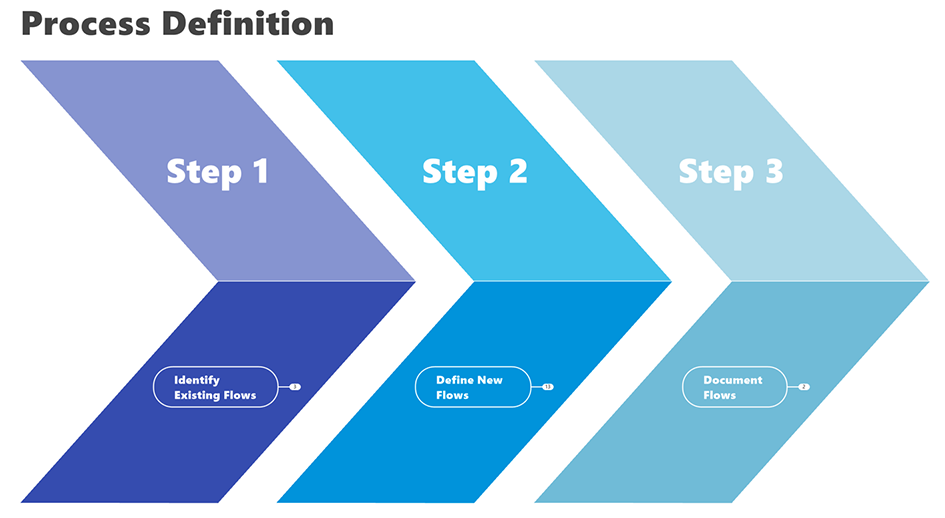
Get templateLike flowcharts, process maps outline steps in a process, using specific symbols and shapes to make them easy to read. For example, diamonds indicate a decision point, while arrows indicate the next step in a process. Use them to visualize the steps in a process, note who needs to be notified, and see what happens once a decision is made.
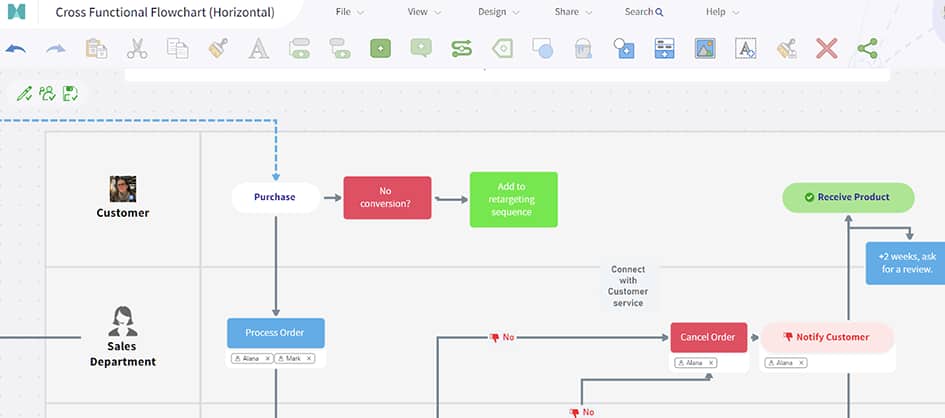
Get templateUse our user flow diagram template to visualize how users move through steps in a process. Track how leads turn into conversions, pages readers visit, or how app users complete a specific task. By breaking the user flow down into visual steps, your team can find ways to streamline the process and improve the user experience.
Get templateAct Agile is dedicated to helping companies improve their processes, products, and services using the Agile project management process. With MindManager, they save up to 50% of their time by making it easier to get an overview of each task, access documents quickly, and spot issues in their client's workflows.
Read case studyFlowcharts are a powerful tool for turning complex processes and workflows into easy-to-understand visual charts. Learn more about how flowcharts can improve your business processes.
You can use MindManager to create flowcharts in two ways. Start with a template (like the ones listed above) and add steps to the pre-created flowchart. Or get fancy and start from scratch, adding your own shapes, arrows, notes, images, and more. There is no wrong way to create a flowchart — try both methods and see which one works best for you.
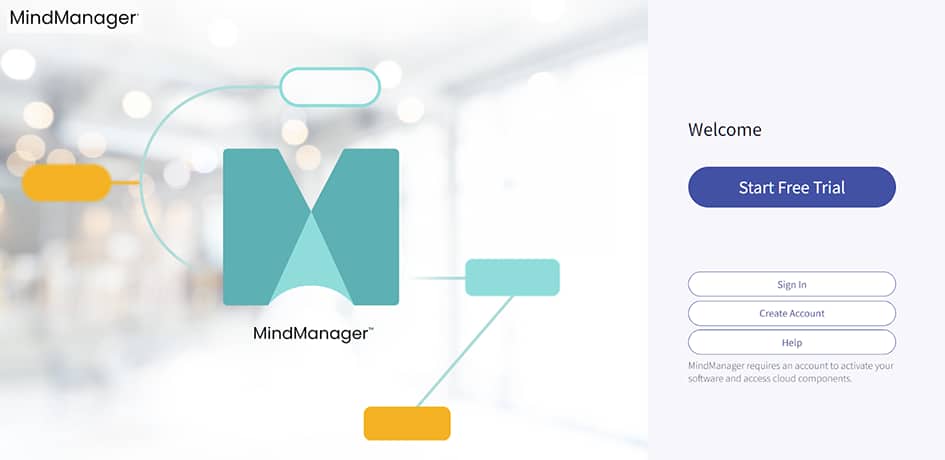
Yes! MindManager offers a 30-day fully functional free trial for all new subscribers. Sign up and start adding images, graphs, GIFs, PDFs, whatever you need to make your flowchart as useful as possible. Explore our templates gallery, including Gantt charts, mind maps, timeline charts, whiteboards, and more.
Mind maps and flowcharts are both visual tools to organize information, but they have different structures and serve different purposes. Mind maps are primarily used to brainstorm, organize thoughts, and connect related topics in a hierarchical structure.
Flowcharts are used to visualize the steps in a process and explore how a user or team reaches a decision or completes a specific action.
Digital flowcharts help teams understand how processes work, spot inefficiencies, and collaborate in real time.
If you're looking to work smarter, MindManager can help.
30-day fully functional free trial