Guide to timelines

What is a timeline chart?

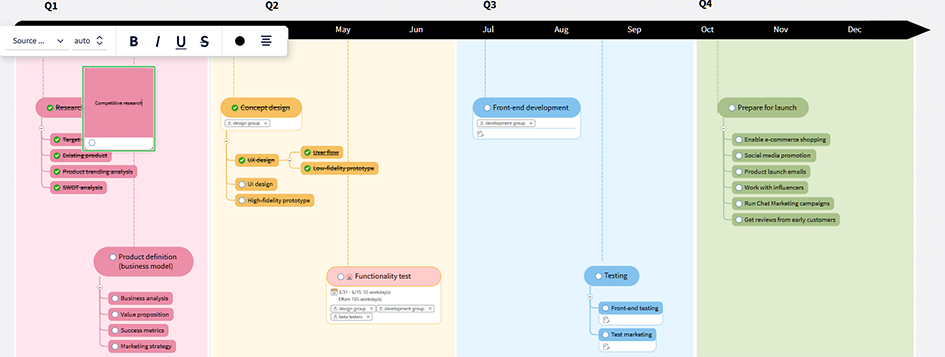
Timeline charts are highly versatile visual charts that are used to illustrate a set of events chronologically. They're an excellent tool for conceptualizing event sequences or processes to gain insights into the nuances of a project. That could include summarizing historical events, or any other time frame where you need to measure minutes, hours, dates, or years.

There are many potential use cases for timeline charts. For example, history students can use them to highlight important events to help remember dates for an exam. Organizations can use them to break down complex projects into more manageable stints. Researchers can also use them to keep track of the time between experiments.

Although there are several different types of timeline charts available to choose from, all timeline charts follow a similar structure. They will all include dates and descriptions, and some will also include images and headers.

Types of Timeline Charts

Types of timeline charts

While all timeline charts contain the elements mentioned above, there are some notable differences among the types you can use. Here, you'll learn more about the variety of timeline charts you can choose from, what makes them unique, and projects that might be a good match for each:

Gantt chart

Gantt charts are grid-based diagrams that break down projects across calendar days. They are typically used as a project management tool for large-scale development projects with multiple stages and a firm deadline. For example, Gantt charts are used widely in the construction industry, where plans are highly dependent on each other, and one part of the project can't start until another has ended. They are also used in industries such as event planning to create a dependency between different tasks.

Gantt charts

Vertical bar chart timeline

Unlike most timelines, which you can easily follow from left to right, a vertical timeline starts at the bottom and ends at the top. They are a popular way to show progress towards a specific goal. As you progress with a particular task or goal, the colored bars feature that progress. For example, fundraisers often use vertical bar chart timelines to show how much progress they have made towards raising a specific amount of money.

Chronological timeline

A chronological timeline is an organized way of showing you when events happen as they relate to a specific time. Chronological timelines typically start with the event that happened first and end with the event that occurred most recently. For example, a history student might use a chronological timeline to help them memorize different events that took place throughout World War 1.

Static and interactive timelines

While static timelines just allow users to look at them, interactive timelines are more dynamic. They typically let users scroll through them, zoom in and out, and even change the data in real-time to display different results. Static timelines are much easier to create and are good when you have a small, concise amount of data.

While dynamic timelines typically require more effort to create, they are an excellent way to display significant amounts of data. For example, a software organization might use a dynamic timeline to visualize critical metrics, coordinate tasks, set deadlines, and identify potential delays.

When should I use a timeline chart?

If you've never heard of timeline charts before, then you might be wondering when to use a timeline chart. There are many instances where it could be beneficial to use a timeline chart to help conceptualize a process or an event sequence. Timeline charts have many potential use cases across various sectors, from product development to education.

Here are some examples of when to use a timeline chart:

Education

Educators often use timeline charts to give students an overview of the details of an event. That information helps them visualize how a series of individual events combine to lead to a larger event.

Product development

Project managers use timeline charts to mark out the journey of a product, starting with the initial idea stage and ending at the launch stage. Even though each product will follow a slightly different timeline, the overall structure is generally the same, making timeline charts a good fit.

Project management

These charts are an excellent tool when project managers need to oversee their team's workload and understand a specific project's progress.

Event planning

Using timeline charts for event planning allows you to create a visual schedule of your event. This means that you can easily see exactly what is happening and when, and helps to make sure that things run smoothly on the day.

Benefits of timeline charts

Timeline charts are a simple way of providing a clear overview of what needs to be done and when – which can help you manage complex tasks and ensure they're completed on time. Some of the benefits of using timeline charts include:

  • Helping you manage and ensure complex tasks stay on schedule in project management situations.
  • Providing visualizations for processes or events occurring over a specific timeframe, like when using them for educational projects or product development.
  • Working as a visual aid to help planners and project managers conceptualize and make decisions about current and future projects.
  • Allowing you to see how to allocate resources easier, such as for event planning or project management.

The linear layout of a timeline chart allows you to visualize a process or series of events that took place over a specific timeframe, making it easier to allocate resources at the right time. This means it can be a good decision-making aid for current and future projects.

How to Make a Timeline Chart

How to make a timeline chart

Here's a list of steps you can follow to make a timeline chart:

  1. Choose an event or process you’d like to represent with your timeline.
  2. Collect all relevant information, such as dates, tasks, descriptions, and owners, that you want to display on your timeline.
  3. Choose a timeline style that will best visualize your event or process. If you choose a Gantt chart, it will appear under “Views” in the desktop app, instead of appearing under the templates section.
  4. Use the date the timeline begins as the first point and the ending date as the final point.
  5. Determine the milestones or important dates your timeline chart should contain.
  6. In chronological order, create a separate space on the timeline for each important date and its corresponding description. You may also choose to include images and headers.

Why use MindManager to make timeline charts?

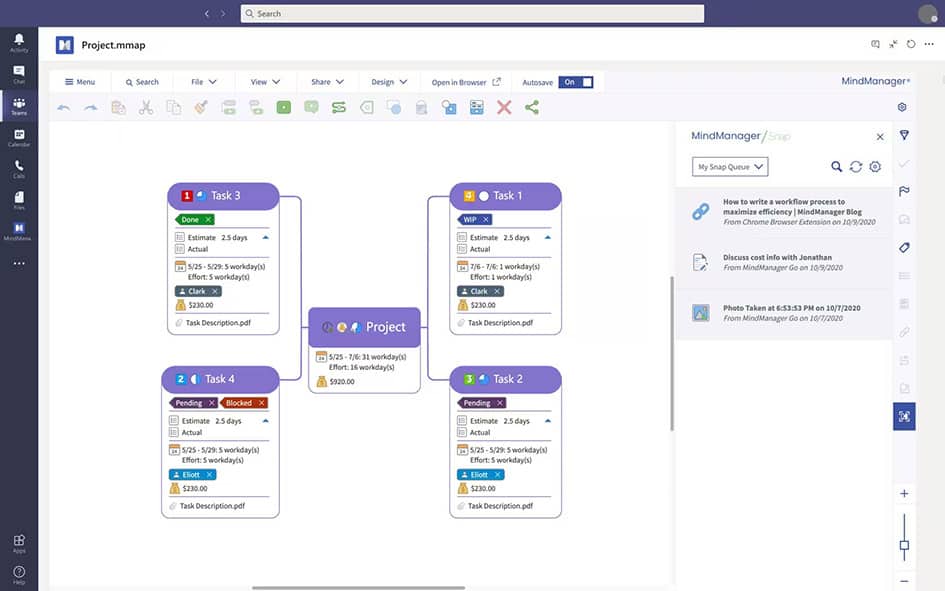
With a few clicks and some essential information, MindManager generates a timeline chart that you can use to assign tasks, define the parameters of a project, or better understand a process.

Some of the key benefits of using MindManager's timeline software to make your timeline charts include:

  • Fast onboarding: You can quickly ramp up productivity.
  • Go-to collaborative mind mapping software: This allows you to keep the rest of your team in the loop.
  • Massive image library: You have access to over 700 topic images ready for you to use.
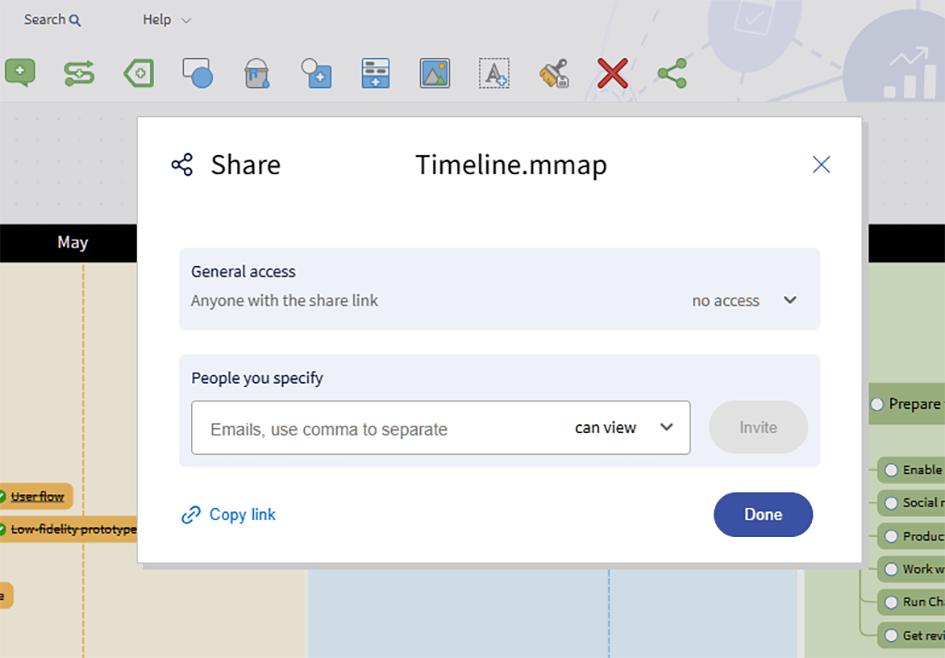
  • Simplified file management service: This allows you to store, retrieve, and share MindManager files quickly.
  • Powerful integrations: Use MindManager with popular apps like Google Docs, Box, and OneDrive.

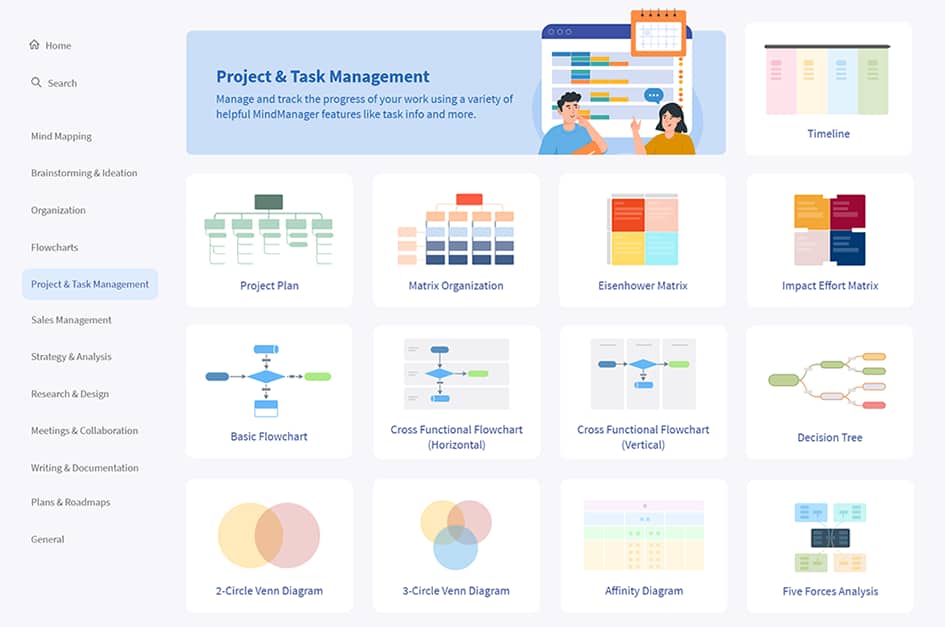
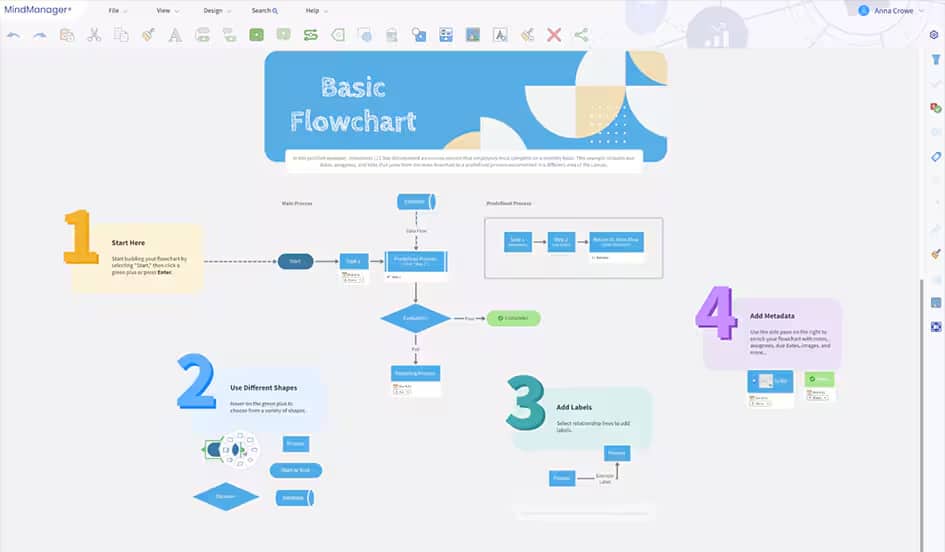
Timeline chart templates

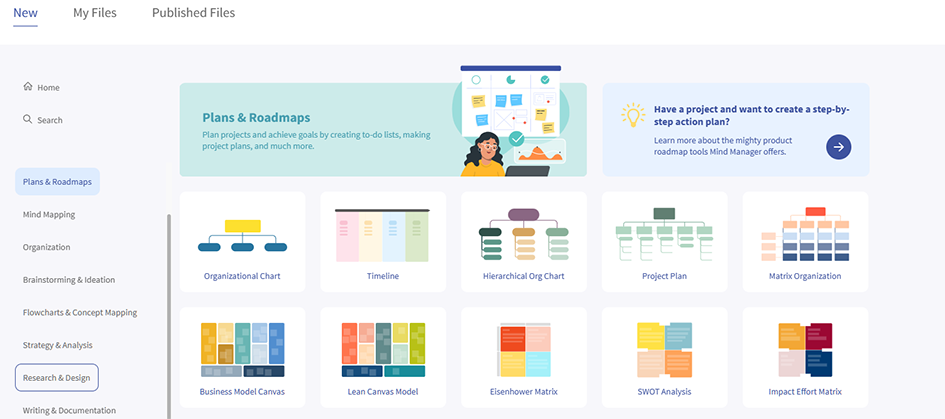
MindManager comes pre-installed with many templates. To use these templates:

  • Open MindManager
  • Click NEW in the navigation menu
  • Select the template you want to use
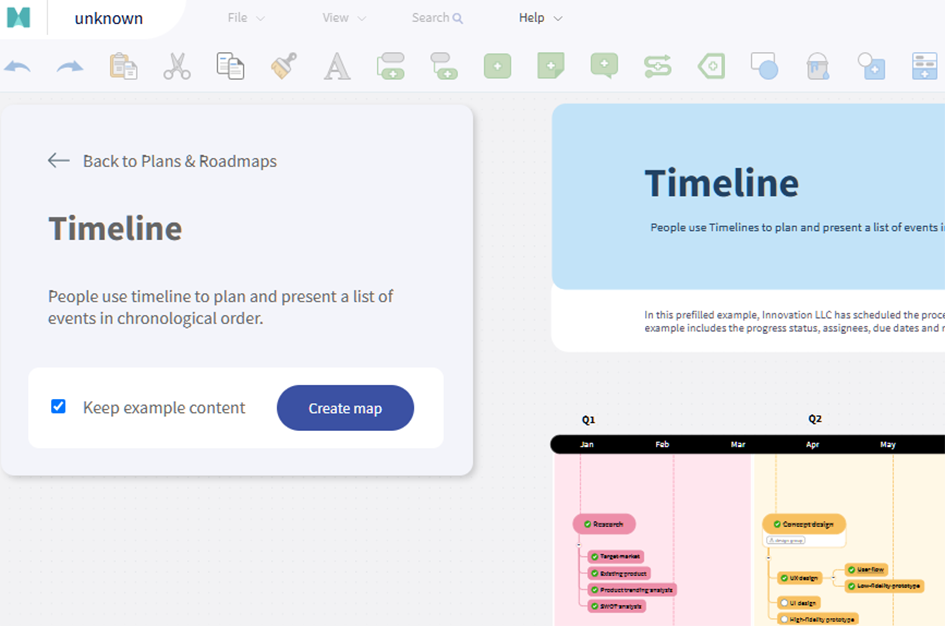
  • A preview screen will appear - check to see if you'd like to use your selected template
  • Select 'Create Map'
  • Customize the template for your specific project
FAQs

Timeline chart FAQs

What are the components of a timeline?

There are four key components of a timeline. Dates and descriptions are the main parts of every timeline, while headers and images used to display additional information are optional.

How do you decide which type of timeline to use?

Deciding which type of timeline to use depends on many factors, such as what kind of information you'd like to display and how much data you have to display.

For example, if you're trying to schedule multiple events that are dependent on each other, then you might choose a Gantt chart. If you're plotting out the key dates of a historical event, you should use a chronological timeline.

Create organized visualizations with a timeline chart

A timeline chart is a valuable tool for organizations that need a concise way to visualize a process or event chronologically. They're quick to set up, and you can easily customize and share them with others once you finish. There is a wide range of timeline charts available to choose from to suit your needs.

Visualize more with MindManager

Ready to build a timeline chart? try MindManager for free, and start building timeline charts right away with premade, customizable templates.

Try the full version of MindManager FREE for 30 days