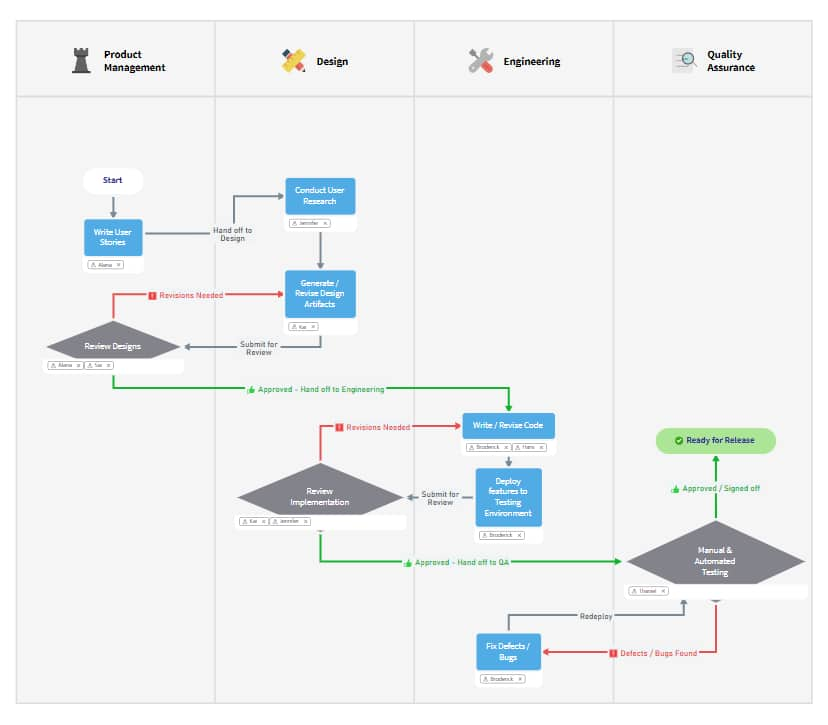
Swim lane diagrams are flowcharts that show a process from start to finish. These diagrams also show who is responsible for each step in the process.
Much like a swimming pool with established lanes for each swimmer, a swim lane diagram has horizontal or vertical lanes belonging to each person involved in the process. Process steps are shown using standard flowchart symbols.
Instead of only documenting the steps in the process, this diagram style allows people to see their responsibilities within an organization efficiently. It also helps people understand how their role fits with the system’s other moving parts. That means responsibility can be handed off from one party to the next more effectively.
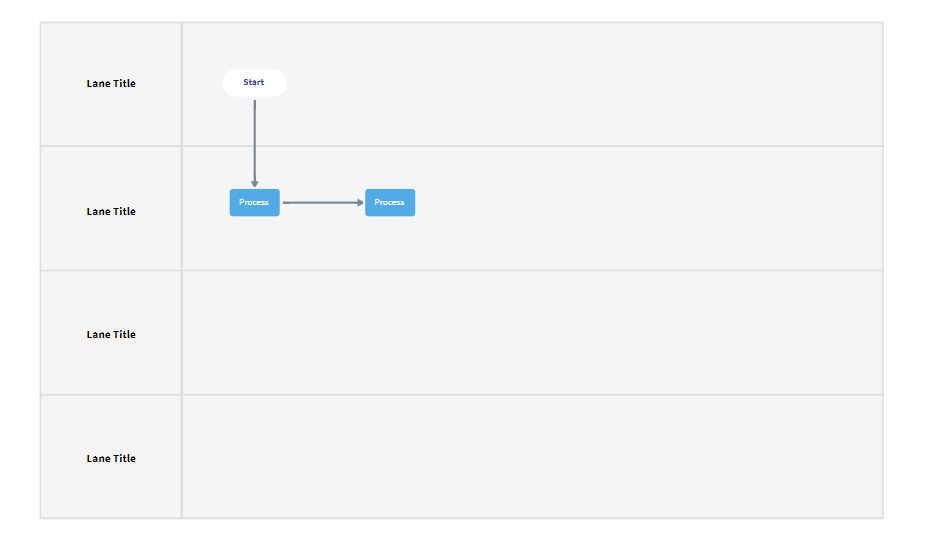
Swim lane diagram symbols are similar to those you use in a flowchart. They include:
| Image | Name | Description |
|---|---|---|
 |
Start/End | Indicates the process’s start or end points. |
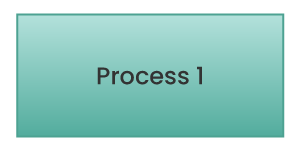 |
Process 1 | Indicates a process, action, or operation. |
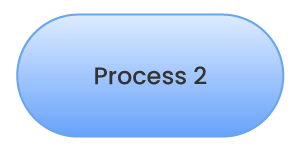 |
Process 2 | Indicates an automatic process that triggers another action. |
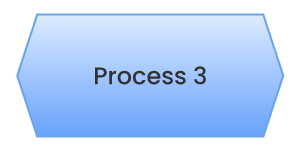 |
Process 3 | Indicates a setup to a subsequent step in a process. |
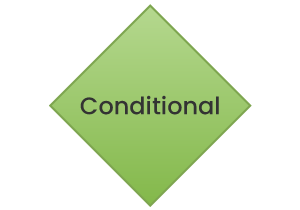 |
Conditional | Indicates a question. |
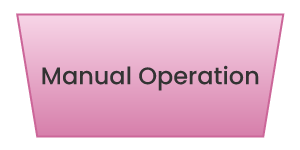 |
Manual Operation | Indicates that the user must manually input information into the system. |
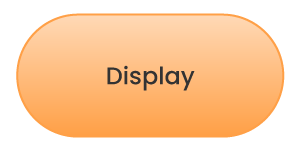 |
Display | Indicates that information must be displayed. |
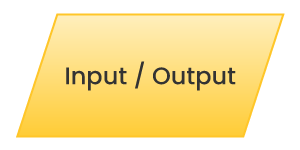 |
Input/Output | Indicates that information should be entered in or should come out of the flow. |
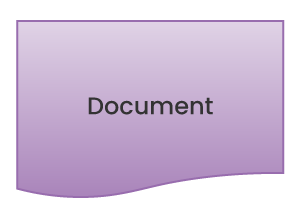 |
Document | Indicates a document or report that is involved in the process. |
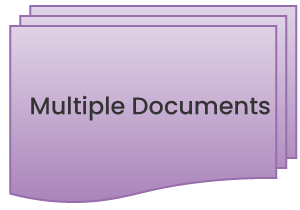 |
Multiple Documents | Indicates that there are multiple documents involved in the flow. |
 |
Start Loop | Indicates the beginning of a loop. |
 |
End Loop | Indicates the point at which the loop ends. |
To help you to understand when to use a swim lane diagram, we have included some examples:
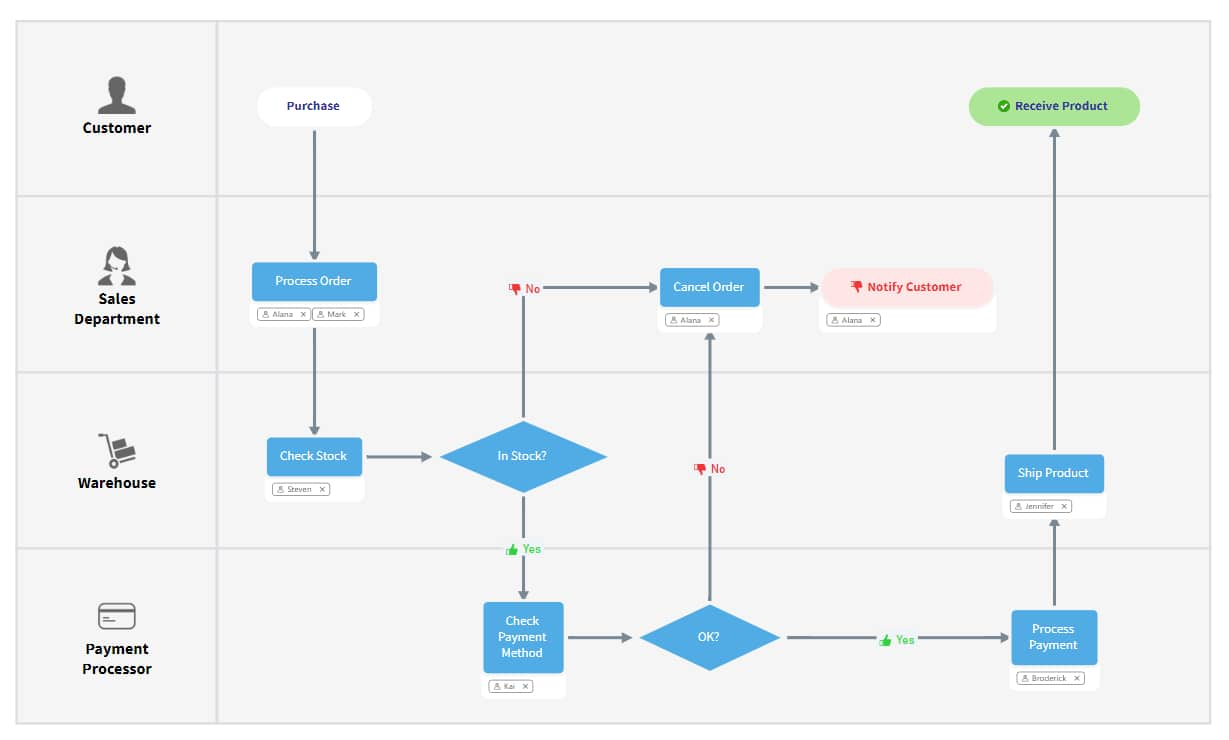
Swim lane diagrams are an excellent tool for modeling a sales workflow. For instance, a corporation can model standard sales workflow processes by showing the internal process of handling a lead.
A lead typically begins as the responsibility of the marketing department, where it is nurtured and marketing-qualified. Then, it is handed off to a sales representative. Once the deal closes, the lead – who is now a customer – is handed off to customer services. From there, it may intermittently move to the marketer's lane for surveys and feedback. Eventually, it will circle back to the sales representative for a contract renewal or product upsell.
By showing this process through a swim lane diagram, marketers know that qualifying the lead isn't the end of their interactions with the customer. Sales reps also can clearly see that renewals are their responsibility. Even better, they know they can turn to marketing for information regarding the customer's experiences and the likelihood of upselling.
Swim lane diagrams can provide human resources staff members with a detailed breakdown of employee responsibilities to help them with onboarding. For example, some of the key responsibilities of a software engineer can be separated into different categories including: development, maintenance, analysis, innovation, and planning. These categories can then be broken down further into more specific tasks.
Swim lane diagrams can help clarify who must be involved in each stage of the audit process. The audit process is divided into multiple stages. Examples include planning, document review, fieldwork, follow-up, reporting, and issue tracking.
Each stage of the process requires extensive communication between multiple parties, including the auditor, the IT department, the senior management team, and the other stakeholders involved.
Accounts payable processes break down into several steps, including receiving the invoice, reviewing the invoice, approving the invoice, and paying vendors. Depending on the organization's size, the complexity of each stage can vary. Given the amount of paperwork involved, keeping payments and processes organized can be challenging.
Swim lane diagrams can provide a clear overview of the stages in the process and make it clear who is responsible. This reduces the chances of late payments and makes it easier to assess the company's financial health.
Here are some of the key benefits of using swim lane diagrams to outline processes within an organization:
Before creating a swim lane diagram, it is important to conduct research and determine your goal. That will help you determine what level of detail you should go into to make your diagram effective.
Once you have a good understanding of what you want to achieve, here are some steps you can follow to create your swim lane diagram:
You can make swim lane diagrams by hand or in any graphic design program or use a program specifically designed for swim lane diagram making. MindManager, an industry-leading swim lane diagram software, allows you to create complex, detailed swim lane diagrams with ease.
MindManager's key benefits include:
MindManager helps you synthesize ideas and information by providing a simple, intuitive framework for organizing your thoughts. With MindManager, you and your team can clarify complexity and collaborate in new and unexpected ways.
MindManager comes pre-installed with many swim lane diagram templates. To use these templates:
A flowchart is a diagram designed to outline a process, system, or algorithm. A swim lane diagram is a specific type of flowchart that outlines who needs to do what in a given process.
Swim lane diagrams confirm who owns each part of a process. They show communication, connections, and handoffs between team members, who are each placed in different "lanes." This helps to provide a thorough overview of a process and highlight inefficiencies.
Visualizing your processes using a swim lane diagram can clarify who is responsible for each process within an organization.
This can help people to understand their responsibilities and also helps them to understand how their role fits in with other roles within the organization.
Swim lane diagrams can also help identify bottlenecks and remove redundancies to improve the organization's efficiency.
Want to visualize your processes and remove the bottlenecks within your organization? Give MindManager a try today and start building swim lane diagrams with our easy-to-use templates.