Understand how different concepts relate and make better business decisions.


Unlock your team's productivity with easy-to-create Venn diagram templates. Whether you're looking to compare different customer bases, find ways to optimize your next project, or explore different marketing channels, Venn diagrams make data visualization easier.
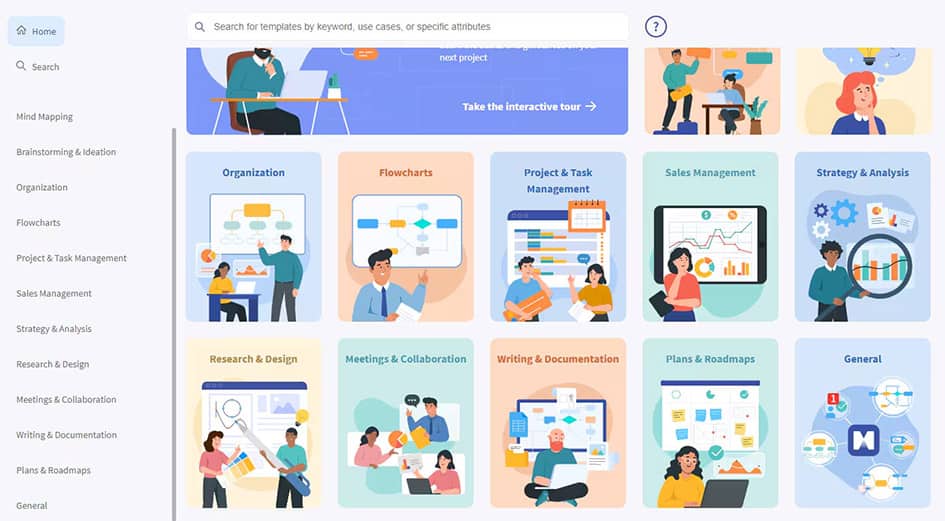
Use pre-designed templates or start from a blank slate and create your own Venn diagram. Add text, colors, shapes, images, documents, and so much more.
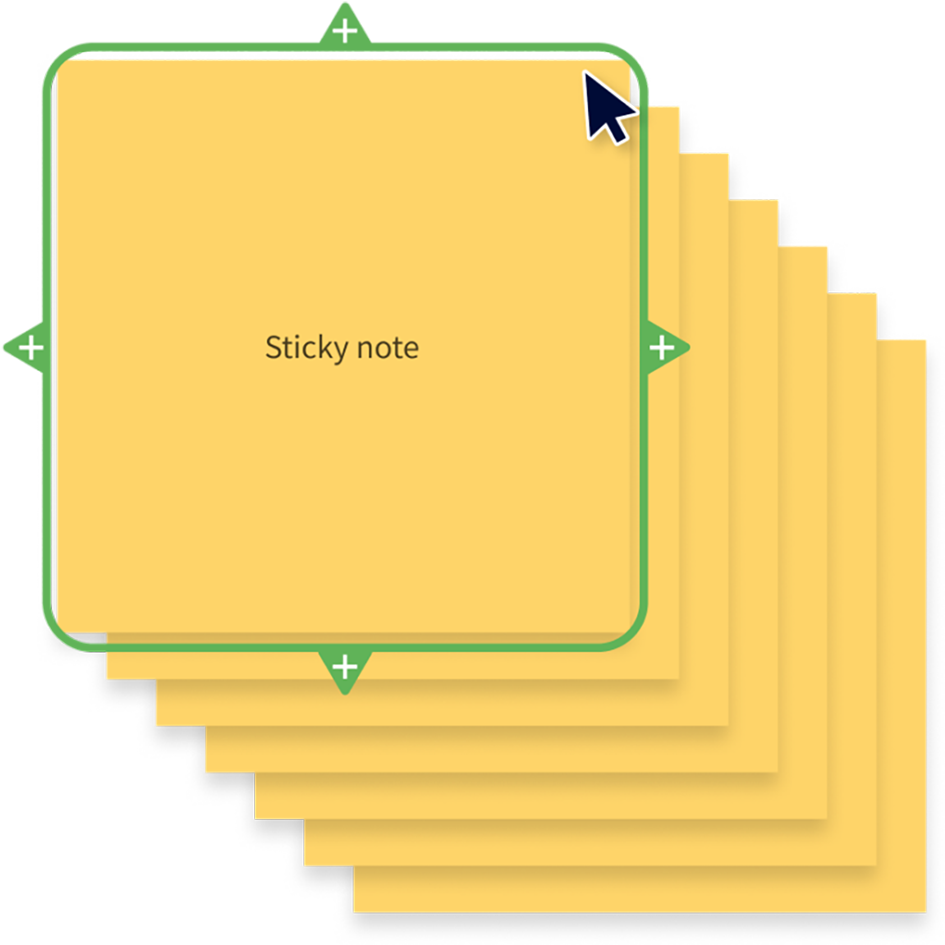
See templatesThe digital equivalent of a Post-it note! Use Sticky notes to add definitions, draw attention to key topics, assign tasks, or highlight stats.
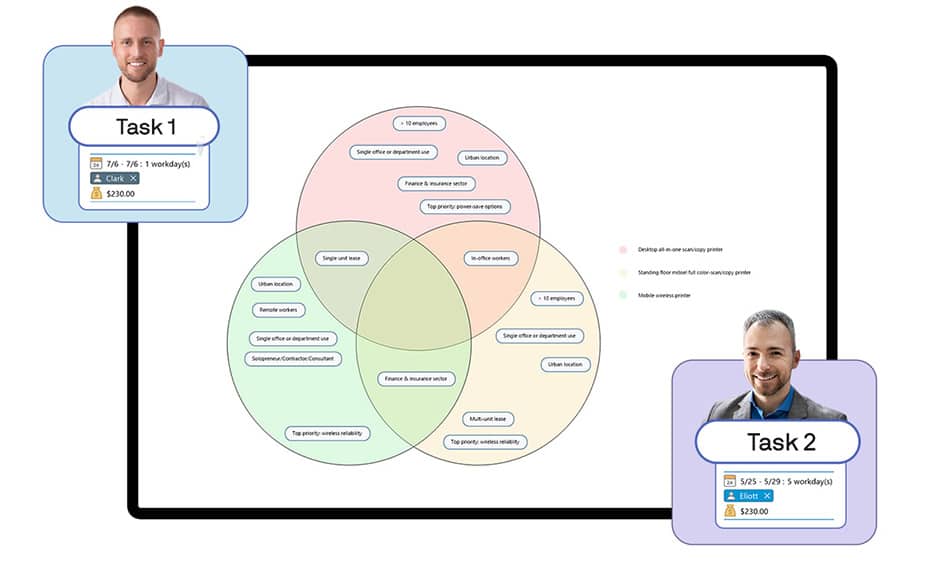
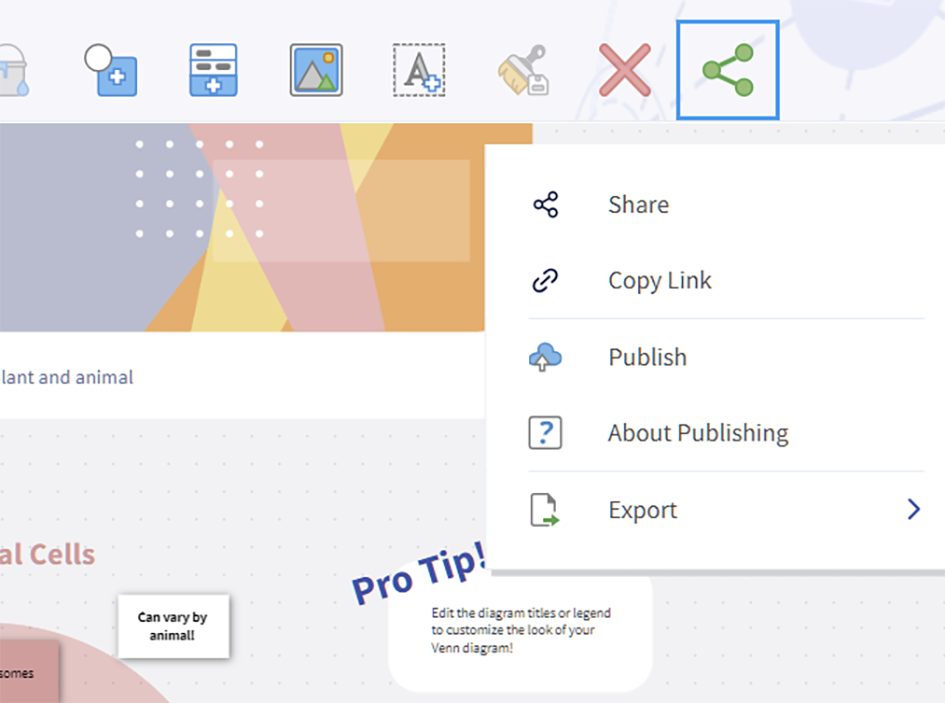
See sticky notesSecurely share your Venn diagram with your whole team—or just key decision-makers.
Increase alignment across teams by linking Jira Cloud and Jira Data Center for seamless ticket management.
See Jira integration4.5 stars based on 565+ reviews
Don’t just take our word for it! Real users cite how MindManager enables them to drive conservations, illustrate their processes and workflows, and is a highly effective, easy-to-use communication tool.
“I like that I can do a very simple diagram (map) when I just need a quick visualization or I can scale up to very detailed flows with notes, tags, resources etc. if that's what the task demands.”
“MindManager allows for flexibility and there are tons of templates.”
“MindManager works for me. It helps to declutter my brain and support the flow of fresh ideas and perspective.”
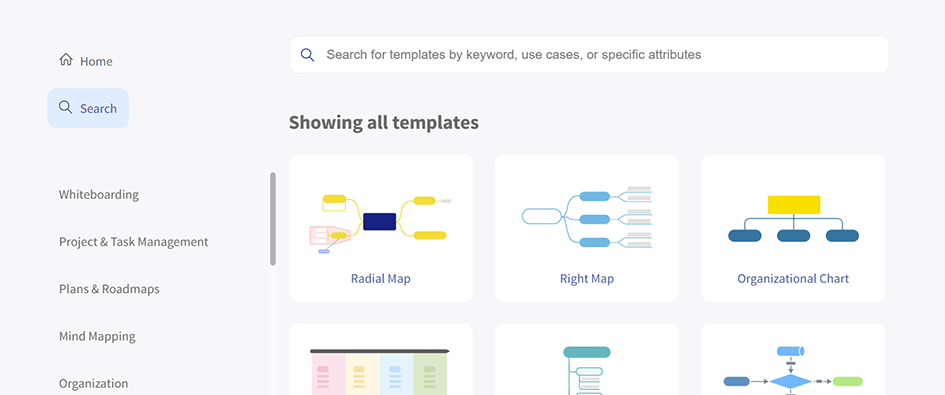
Templates make it easier to get started with MindManager! Use our pre-designed diagrams to kickstart your analysis,
then add information, tasks, sticky notes, and more.
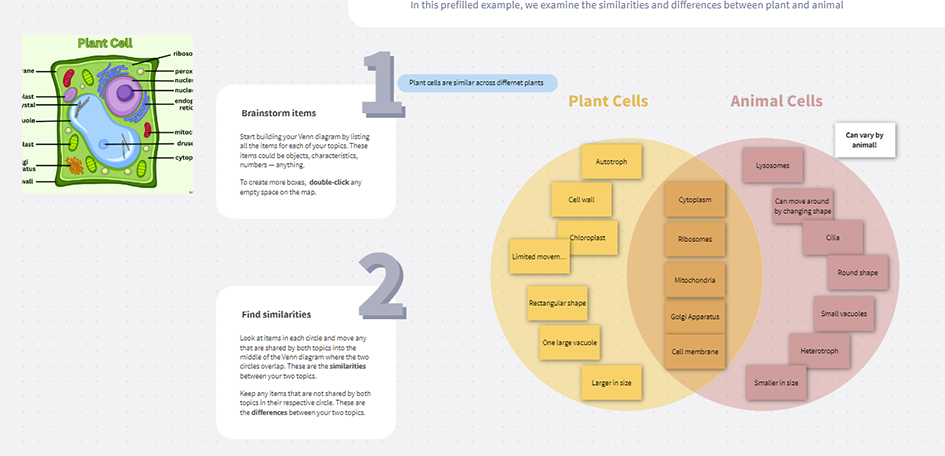
Ready to create your own Venn diagram? All you need is at least two concepts you want to compare and a few minutes of your time.
Tip: If you don't want to use one of our professionally designed templates, you can also start with a blank slate! Choose the "whiteboard" template and uncheck the box that says, " Keep example content."
Remember, your Venn diagram is a living document. Feel free to add more information over time, connect important documents, or add flowcharts to plan a project related to your Venn diagram.
Venn diagrams have tons of use cases across teams, including product marketing, sales, management, and customer success.
The Murauer Brewery in Austria is dedicated to sustainability and tradition. The team found that mind maps help them work more efficiently. Whether they're planning an event, calculating budgets, or recording miles for their CO2-neutral vehicle fleet.
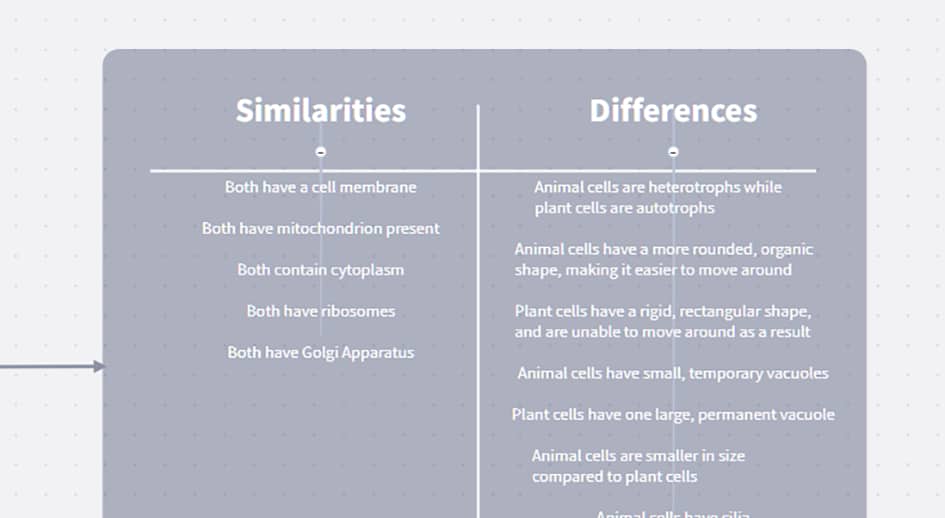
Learn moreVenn diagrams are incredibly useful visual tools for collaboration, data comparison, and understanding the relationship between different topics. Read on for a deeper understanding of how to create and use these visual aids.
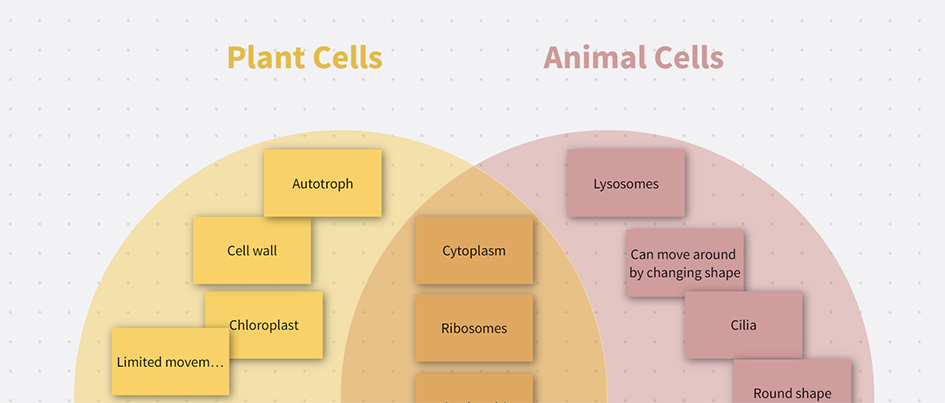
The simplest way to create a Venn diagram is by drawing two overlapping circles. These circles represent two different topics or ideas. Then, add information the ideas don't share to the outer portion of the circle and information or data the topics do share where the circles overlap.
However, drawing a Venn diagram by hand can limit its usefulness. Using MindManager, you can create your diagram and add sticky notes, images, documents, tasks, and more. The Venn diagram can also be shared to improve team collaboration.
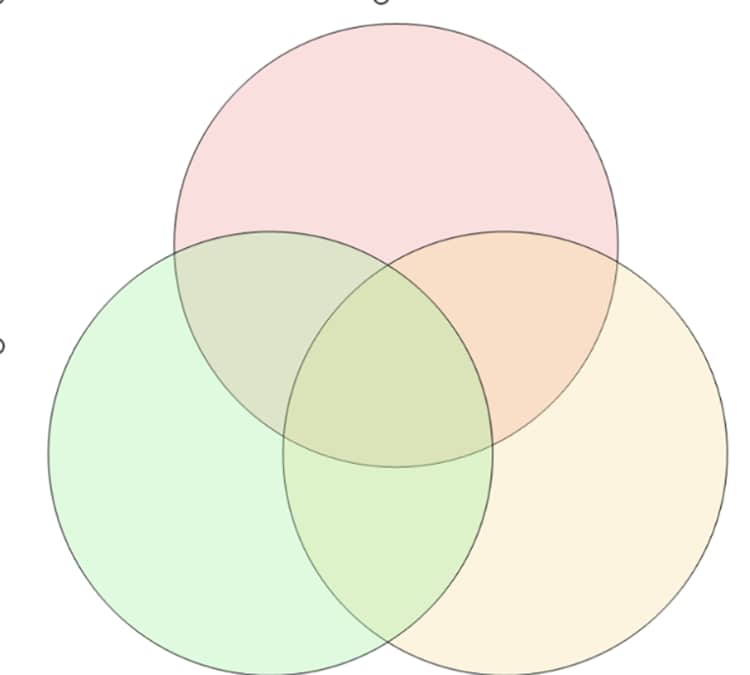
While most Venn diagrams have two circles, adding a third overlapping circle allows you to compare three different ideas or data sets. Start by creating two overlapping circles side-by-side. Then, add a third circle that overlaps both circles and creates a three-layer overlap in one section, like this:
Alternatively, use MindManager's three-circle Venn diagram template to quickly create your Venn diagram.
Yes, you can create a Venn diagram with MindManager using two methods. First, you can add the circle elements to a digital whiteboard and add colors, data, and labels, as needed. Or you can use the Venn diagram template to easily create two- or three-circle Venn diagrams.
Venn diagrams are a powerful tool for data visualization and analysis with applications across your entire company. Whether you're planning a marketing campaign, analyzing customer feedback, or launching a new feature, MindManager makes it easier to compare ideas using Venn diagram templates.
30-day fully functional free trial