A matrix diagram is a project management and planning tool for displaying and analyzing the relationships between two or more data sets. Also known as matrix charts, matrix diagrams provide a valuable, visual look at complex information that might otherwise be difficult to understand at a glance.
Matrix charts are great for displaying, organizing, and analyzing many types of data sets, including:
There are several types of matrix diagrams, each with a different shape and different ideal use cases.
L-shaped charts are the most common type of matrix diagram intended to display the relationship between two data sets. At a glance, L-shaped matrix diagrams look like simple data tables, with one data set represented in the top row and another data set represented in the left column. The intersecting cells contain additional information and context in the form of numbers, labels, or symbols. Use an L-shaped matrix diagram when comparing two sets of data. For example, you could create an L-shaped chart to display the relationships between staff members and work shifts.
If you have three groups of data to compare, you can create a Y-shaped matrix chart by arranging the data sets in a Y-shape. It can also help to imagine a triangle with a list of items from each side. The three data groups should be closely related in a Y-shaped matrix diagram. That way, the chart can compare each group to all other groups. An example of a Y-shaped matrix diagram could include a chart featuring the relationships between staff members, work shifts, and locations.
A C-shaped matrix diagram is another way of representing three data groups. Unlike the Y-shaped chart, the labels are arranged in a sideways C shape—one on the left, one across the top, and one on the right. The shape of the chart resembles a 3D cube, and it can be difficult to draw without the help of a matrix diagram software. C-shaped matrix charts can display the same type of data as Y-shaped charts. For example, you could create a chart depicting the relationships between staff members, work shifts, and work locations.
T-shaped matrix diagrams are shaped like a sideways T and are used to compare three distinct groups of information. Unlike Y-shaped and C-shaped diagrams, they are best for situations where you want to compare two data groups to a third group but not to one another. For example, the chart could display the relationships between products and manufacturers and the connections between products and customers—but not between manufacturers and customers.
An X-shaped matrix diagram is one of the most complex of these examples. Although it displays four different data groups, it's easiest to understand X-shaped diagrams in the context of their similar T-shaped counterparts. For example, you could create an X-shaped matrix using the scenario from the T-shaped matrix above to make a chart displaying:
But not:
With so many types of diagrams, maps, charts, and graphs available, how do you decide when to use a matrix diagram? In general, matrix diagrams are great for:
Some other, more specific use cases for matrix diagrams include:
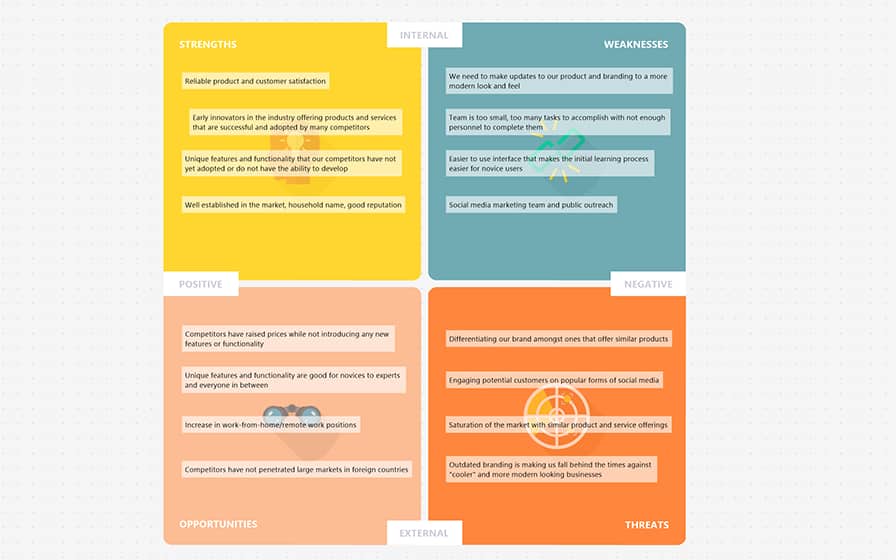
SWOT analysis is a strategic planning and management technique to help identify strengths, weaknesses, opportunities, and threats within a project, team, or organization. There are many ways to set up a matrix diagram for a SWOT analysis—a simple L-shaped matrix is a great place to start.
For businesses that provide products or services according to specific customer requirements, a matrix diagram is useful for tracking and displaying those requirements. You could use an L-shaped or Y-shaped matrix diagram with whatever data groups you want to compare customers, specifications, products, and account managers.
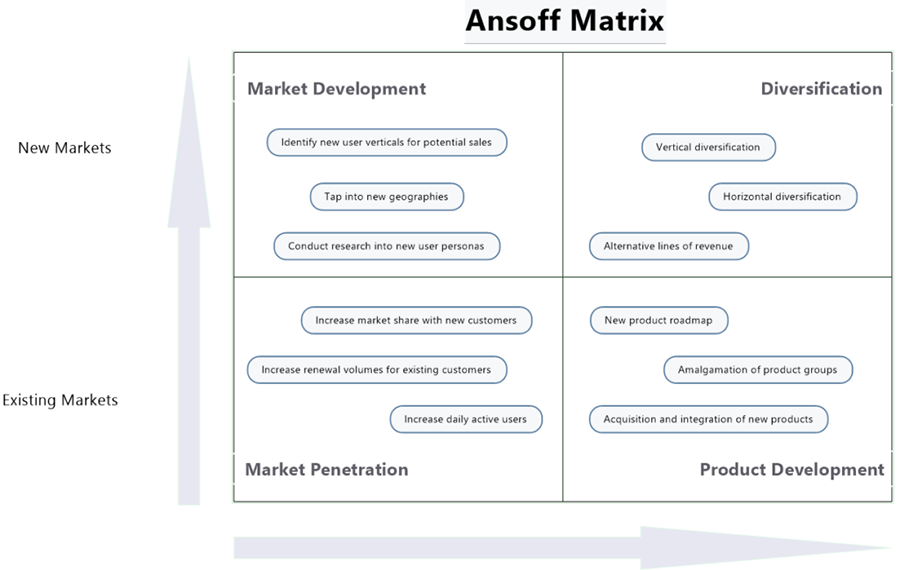
Many executives, marketers, and other professionals use matrix diagrams as a strategic planning tool for exploring and identifying strategies for growth and expansion. One specific type of strategic planning matrix is an Ansoff matrix, also known as a product/market expansion grid. An L-shaped diagram is a common format for an Ansoff matrix, but you could use any type of matrix to support your strategic planning goals.
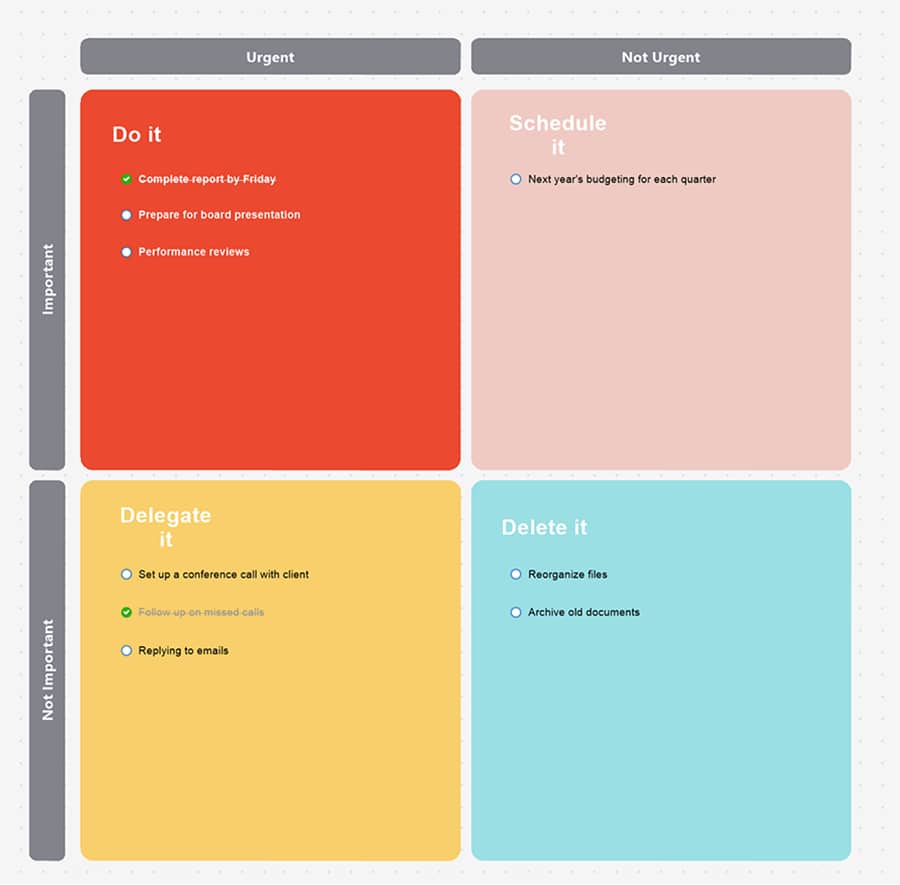
You can use a matrix diagram to explore issues and opportunities in resource allocation, logistics, and other business efforts. The above-mentioned idea of a chart displaying the relationship between staff members and work shifts is one example of a resource allocation matrix.
Their versatility is one of the primary benefits of matrix diagrams, as demonstrated by the wide variety of use cases. Other key benefits of matrix diagrams include:
Matrix diagrams make understanding the complex relationships between different project elements easier. By arranging data groups in a visual framework, you can easily see and label the points where various ideas intersect.
Once you can see and understand all the elements at play in your matrix diagram, it's easier to make informed, strategic decisions about the project or problem at hand.
Ultimately, matrix diagrams are a powerful tool for improving processes and solving problems. They provide a structure for data and a systematic way to evaluate how data groups interact.
Learning how to make a matrix diagram by hand is straightforward, and if you have access to a graphic design or matrix diagramming software, it gets even easier. Once you've decided on the rows and columns of data you'd like to analyze, you'll need to select a type of matrix diagram and create a template. From there, simply input your data groups and label the intersection of each data point using whatever notation works best to classify those relationships.
Follow these steps to create a matrix diagram:
While you can make hand-drawn matrix diagrams, we recommend using a digital matrix diagram maker. Matrix diagram tools like MindManager allow you to create large, complex charts that are easy to edit and share.
MindManager is an industry-leading collaborative mind mapping and matrix diagramming software. Key benefits of using MindManager include:
MindManager is a powerful tool for boosting productivity—it empowers plans, projects, and processes, helping you transform abstract, unstructured ideas into dynamic visual diagrams. Bring clarity to your communication and take your teaming capabilities to the next level with MindManager.
MindManager comes pre-installed with many matrix diagram templates. To use these templates:
There are several types of matrix diagrams, each with unique features and ideal use cases. For example, L-shaped matrix diagrams are commonly used to compare two data sets. Select a matrix diagram based on your objective, data type, and the number of data groups.
Use a matrix diagram when you need to identify and evaluate the relationships between multiple data groups. Common uses for matrix diagrams include SWOT analysis, requirements gathering, strategic planning, and resource allocation.
Before creating a matrix diagram, consider what insights you hope to gain and what data you plan to use. Then, choose the matrix diagram shape that best fits your data and objective and start building your diagram.
Matrix diagrams are powerful tools for project management and strategic planning. They provide a way to organize and analyze complex data groups and their relationships visually. Individuals and companies use matrix diagrams to facilitate project planning, process improvement, product development, and more.
Want to make a matrix diagram? Try MindManager, and build any type of matrix diagram using our library of premade templates, icons, and images.