Improve your process documentation, streamline your workflow, and get more done in less time.


Workflow diagrams create a visual representation of a business process, project, or job. Outlining the different tasks or steps in a process helps your team stay organized and spot inefficiencies faster. MindManager is a full-featured platform that makes creating diagrams easier—and more fun.
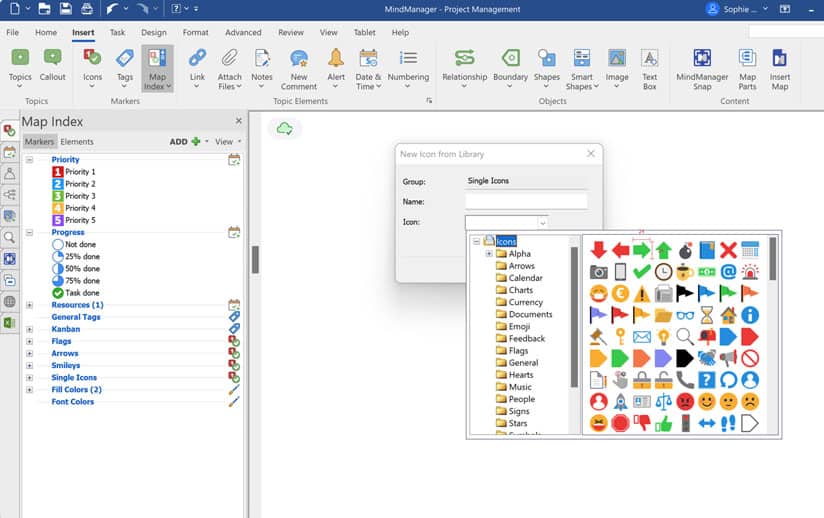
Our fully customizable templates allow your team to add color, text, images, documents and more to your workflow diagrams.
Virtual sticky notes can be used to highlight important concepts, add context to complex diagrams, or ask collaborators for feedback.
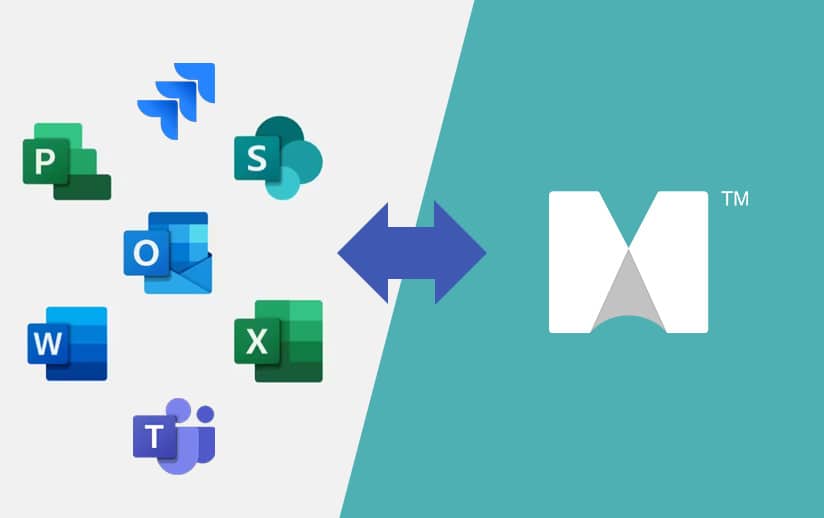
See sticky notesMindManager offers deep integrations with platforms like Jira and Microsoft 360, making collaboration and process documentation easier than ever.
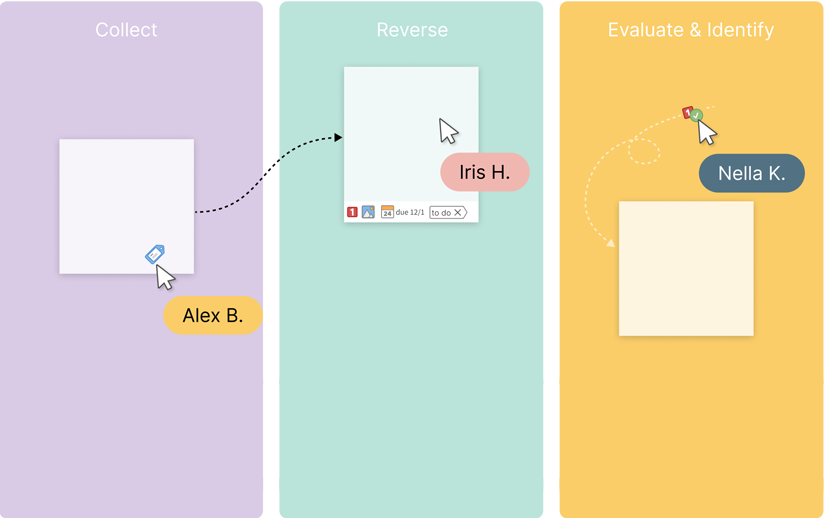
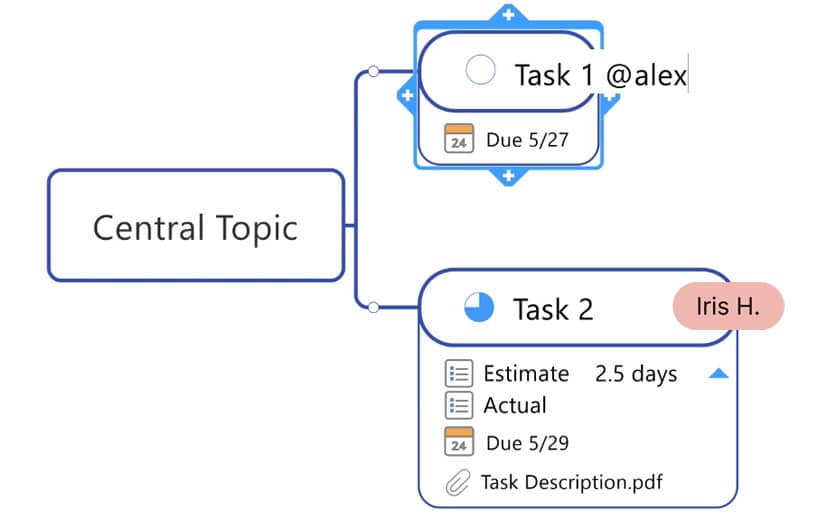
See integrationsImprove collaboration by tagging other users, assigning tasks, creating due dates, and setting priorities.
4.5 stars based on 565+ reviews
“I like that I can do a very simple diagram (map) when I just need a quick visualization or I can scale up to very detailed flows with notes, tags, resources etc., if that's what the task demands.”
“The tool is rich in functionality and is very intuitive to use.”
“A very customizable mind mapping tool.”
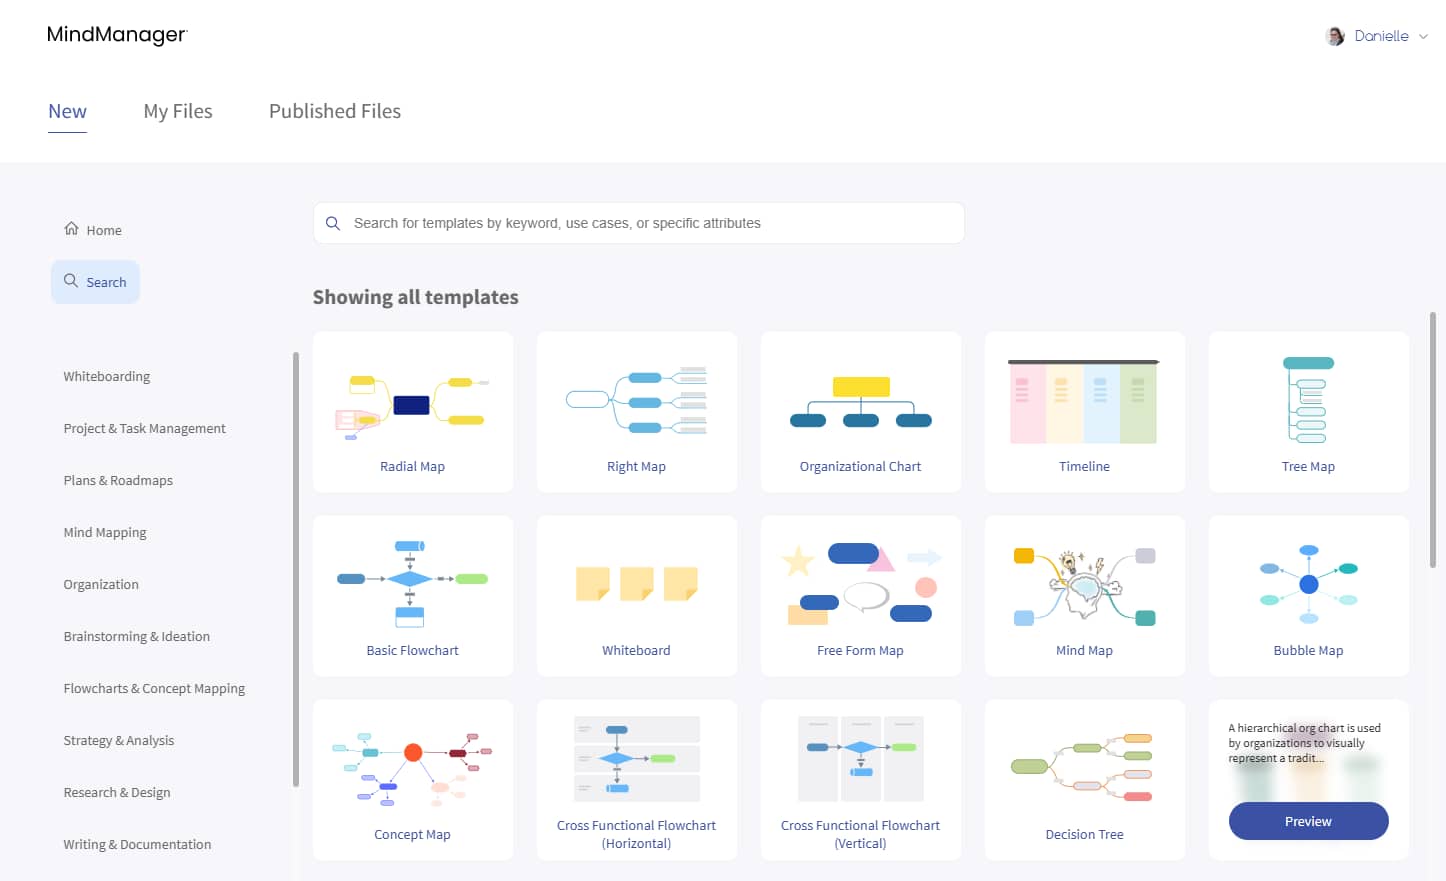
MindManager templates make it easy to get started documenting your workflow processes.
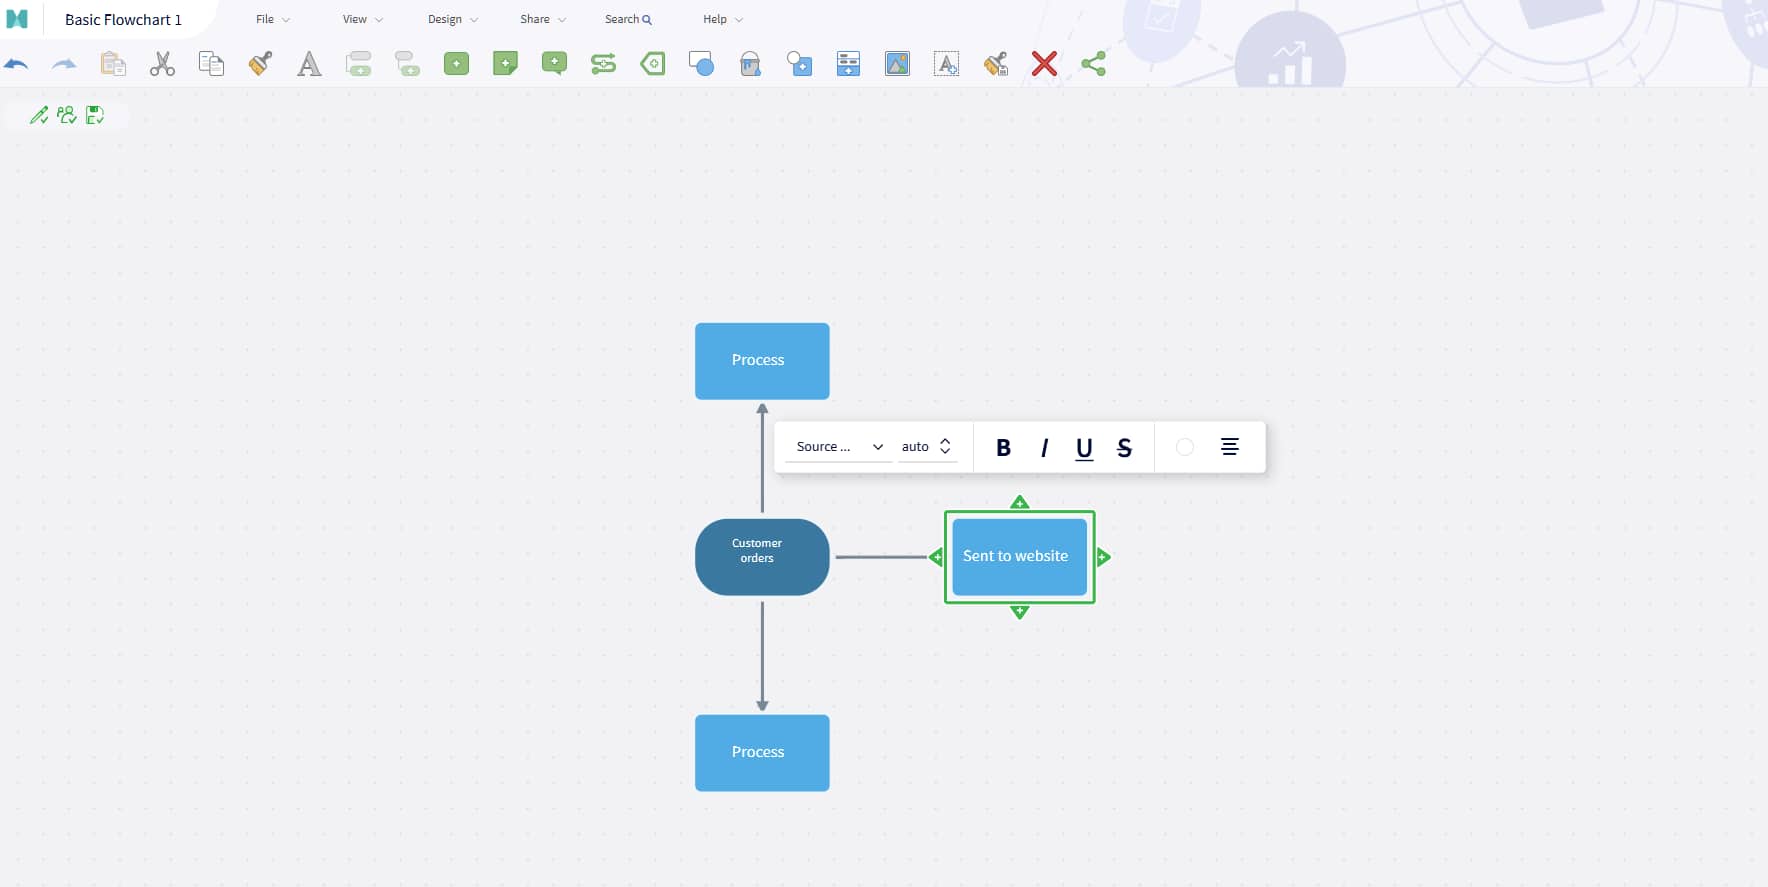
Ready to create your own workflow diagram? MindManager makes it simple to create customized diagrams that fit your needs. Here’s how to get started.
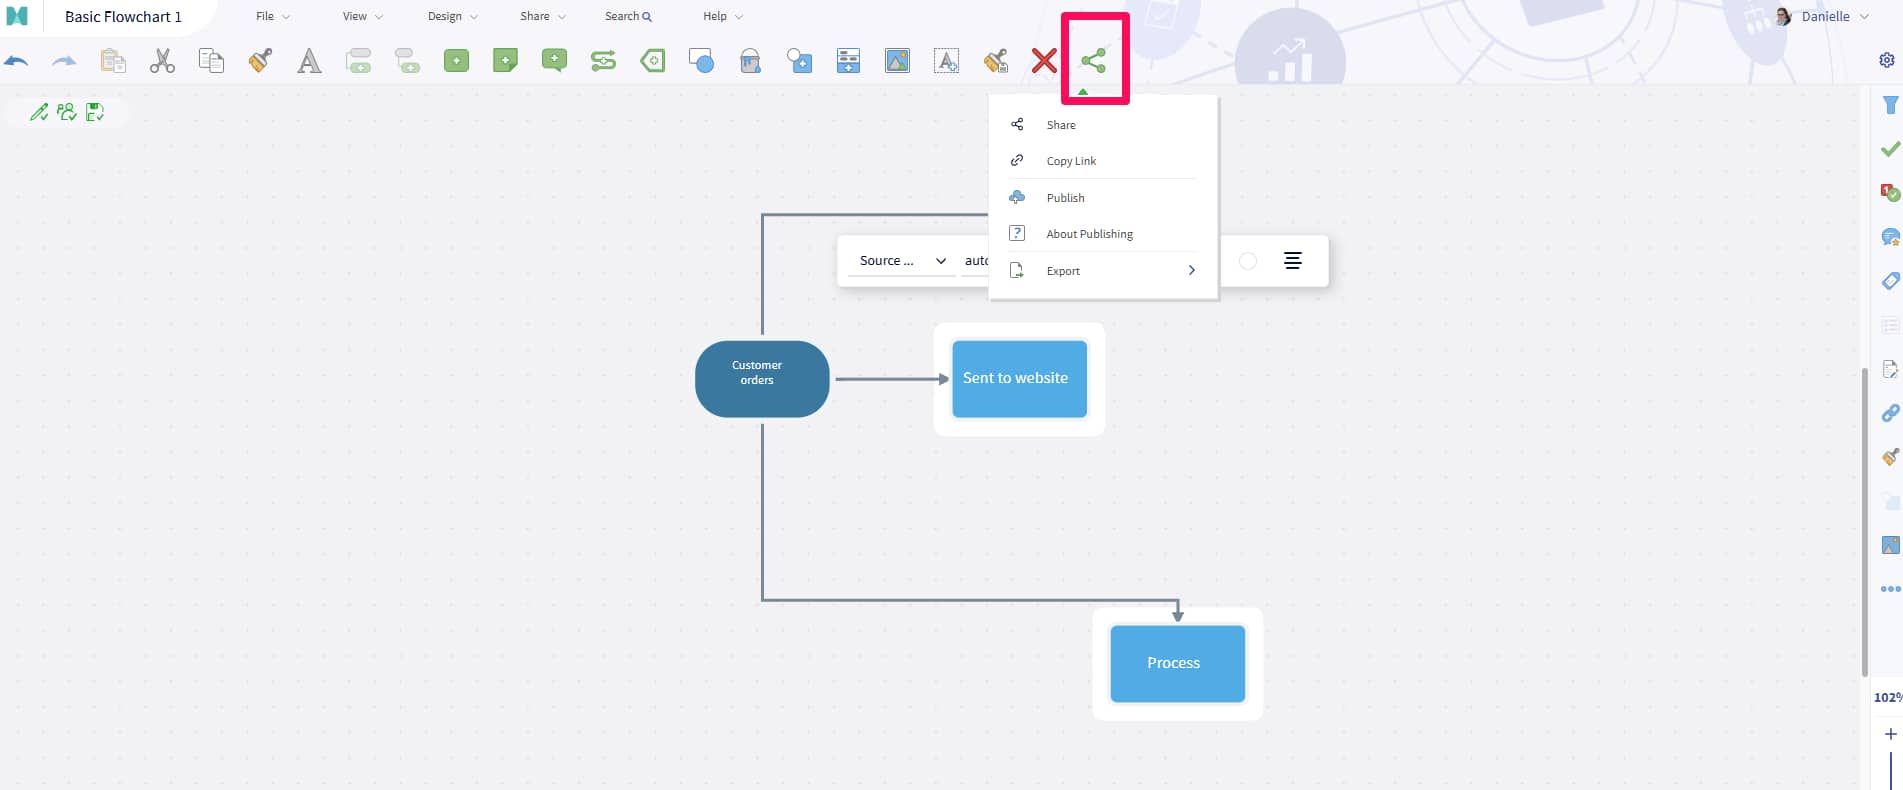
Once your workflow diagram is complete (or when you’re ready to loop your team into the creation process), click the share button. Set sharing options and copy the link.
That’s it! You’ve created your own workflow diagram!
GPSEA is a government agency dedicated to managing the growth of communities surrounding Paris. In addition to urban planning, the agency is responsible for public services like waste collection, pools, and libraries. MindManager helps the GPSEA team collaborate more effectively and gain a deeper understanding of their processes.
Learn moreStill wondering if workflow diagrams can help your team? Here are answers to the most-asked questions about these powerful visual tools.
Sign in (or create a new account), select a template, and then customize your workflow diagram. Add new steps, connect related processes, and then add images and documents as needed.
The three main types are process flowchart, workflow diagram, and swimlane flowcharts.
A process flowchart is used to outline a step-by-step process of a task or project. A workflow diagram explains how a business functions, such as how tasks are handed down or how to outline the company's hierarchy. any. Swimlane flowcharts are used to depict multiple flows of information in a side-by-side format.
While all three types of process flow diagrams are similar, they have different use cases.
A flowchart is a visual representation of a process, showing the sequence of steps using symbols like arrows, rectangles, and diamonds. While similar, a workflow diagram focuses on the movement of tasks or information between different people or systems, often highlighting roles and responsibilities within a process.
Workflow diagrams are a valuable tool to simplify complicated processes, standardize procedures, and improve collaboration. MindManager allows you to create customized, visually appealing diagrams that help your team work smarter.