MindManager has charts, maps, and board templates to help you organize, plan, process, problem solve, and brainstorm your projects. Try it free today!
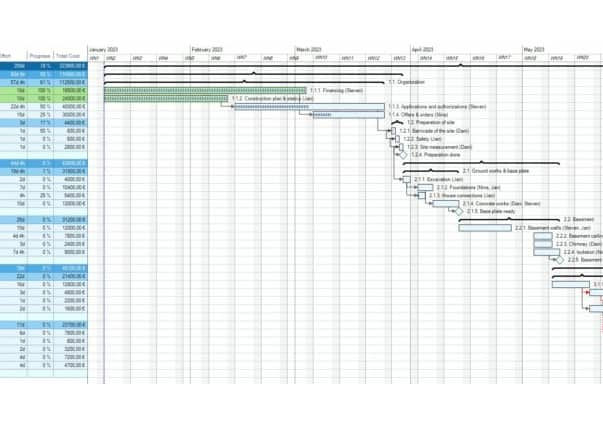
A Gantt chart is a project management tool that shows tasks, activities, or events across a specific timeframe.
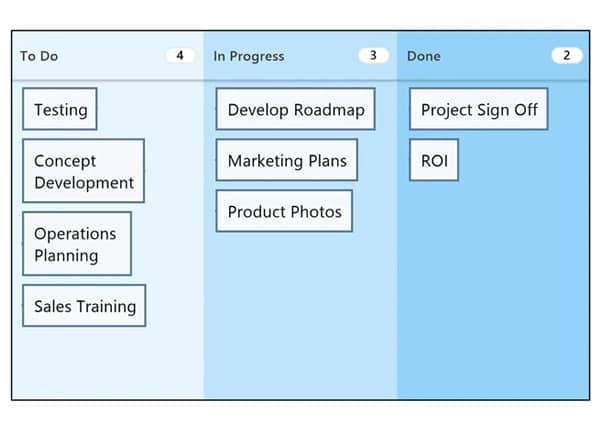
A Kanban board is a project management tool used for workflow visualization.
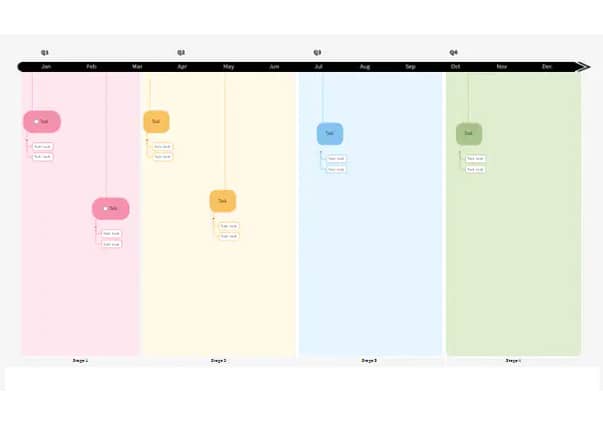
Timeline charts are highly versatile visual charts that are used to illustrate a set of events chronologically.
A Program Evaluation and Review Technique (PERT) chart is a project management tool used to organize and schedule out tasks.
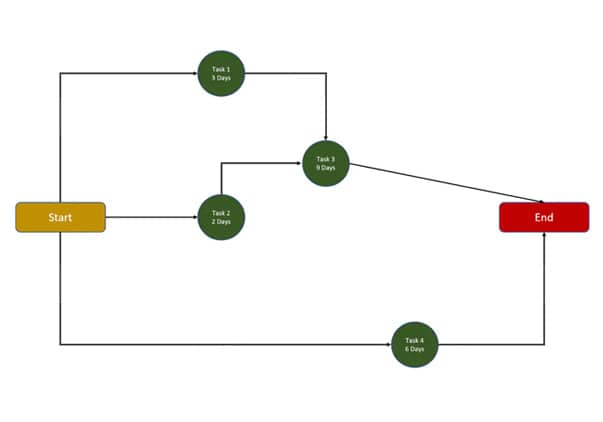
CPM, which stands for Critical Path Method, is an algorithm of resource utilization that schedules project activities.
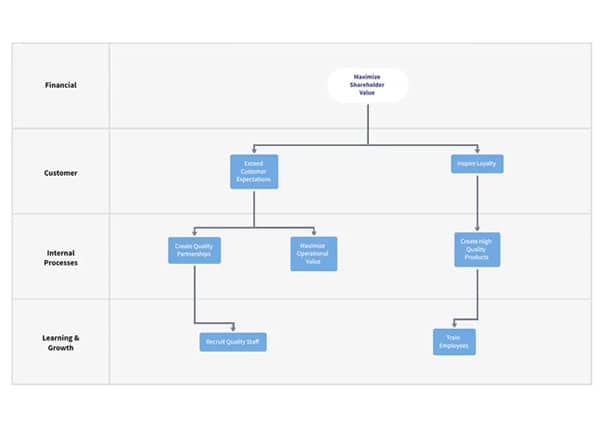
A strategy map is a visualization tool that helps organizations see their main goals and how they connect and relate to each other.
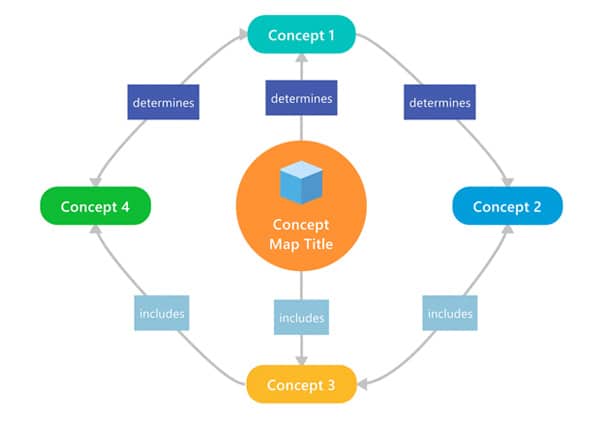
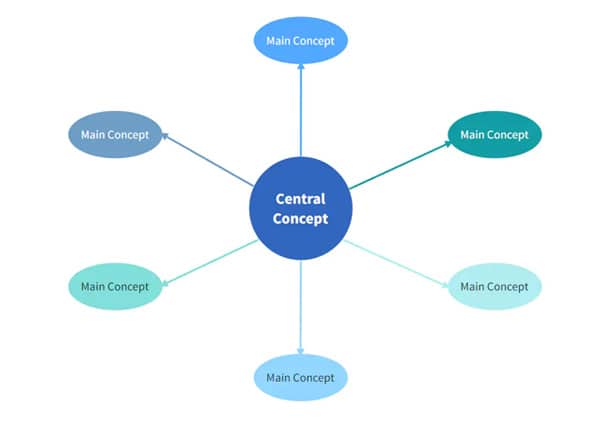
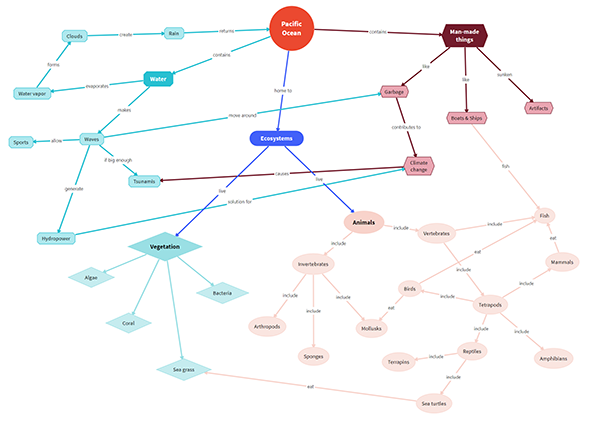
A concept map is a way to visually display the relationships between different concepts, ideas, and pieces of information.
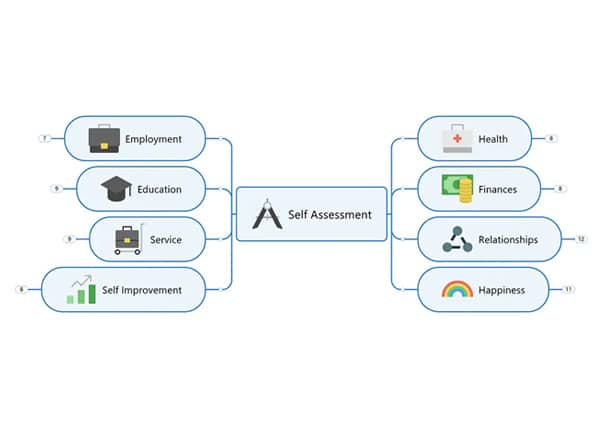
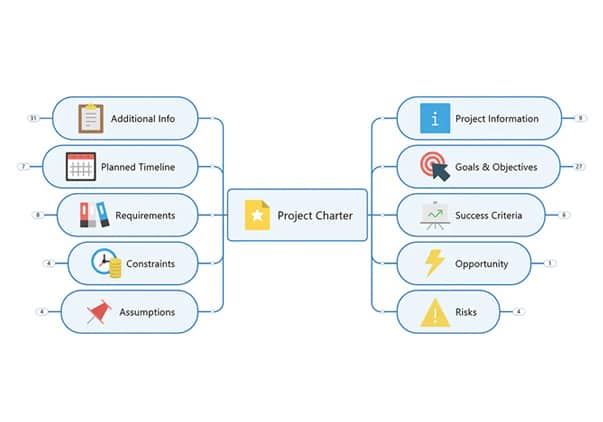
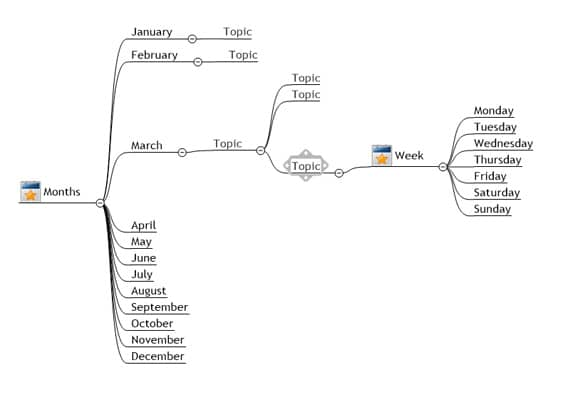
A thought map is a visual way to document existing knowledge about a particular subject or topic.
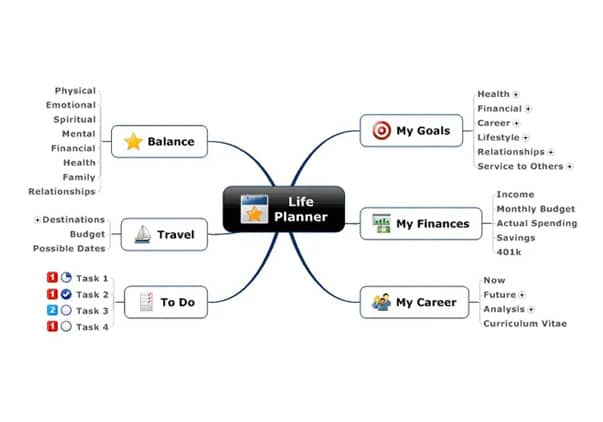
A life map is a timeline that includes key moments from the past, helping you gain a broader perspective of the goals you're trying to achieve.
Visual mapping is an image of an idea — a network of suggestions and options that spreads out from an original word or phrase.
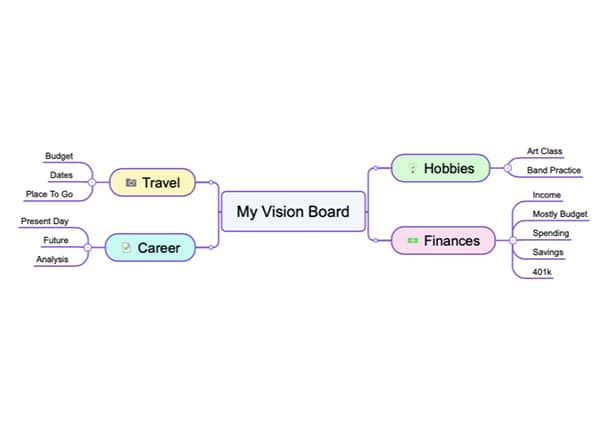
Whether you need inspiration or organization at work, in your personal life, or for a particular project, digital vision boards, creating a digital vision board in MindManager can help make it happen.
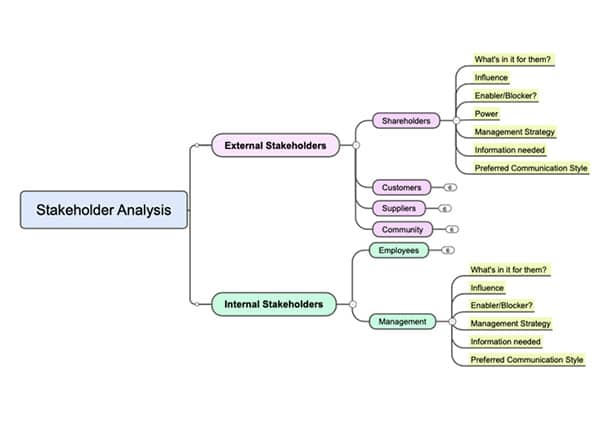
Stakeholder mapping is the process of identifying, analyzing, and evaluating the needs of stakeholders interested in or impacting a project.
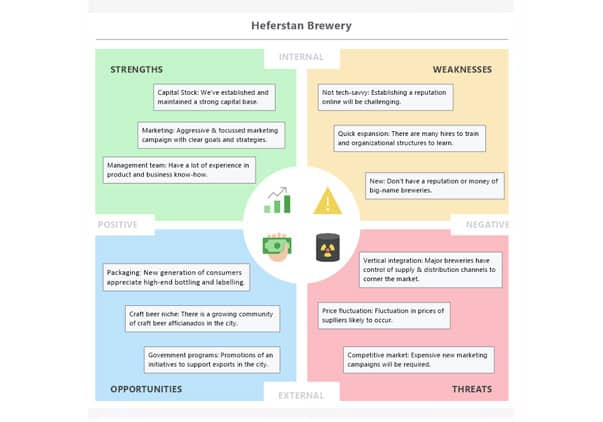
Map out strengths, weaknesses, opportunities and threats to your business in this SWOT analysis template.
MindManager’s monthly planner template is your key to staying organized and on track. Create your planner today and experience the benefits for yourself.
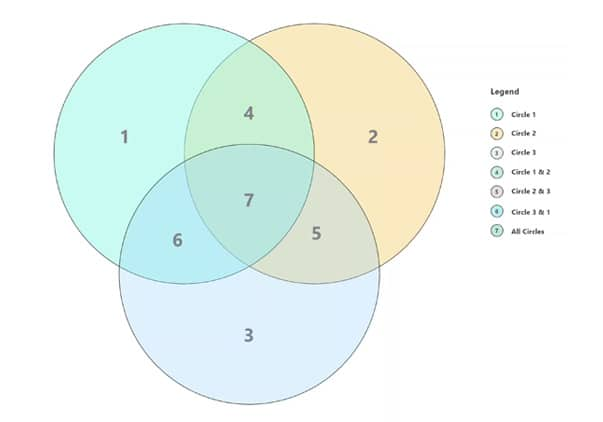
A Venn diagram illustrates the relationships between two or more data sets.
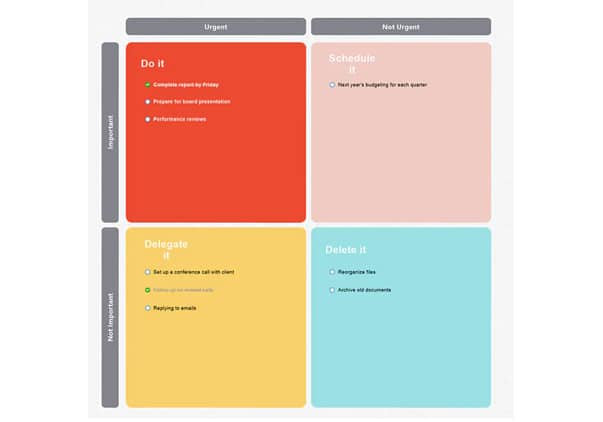
A matrix diagram is a project management and planning tool for displaying and analyzing the relationships between two or more data sets.
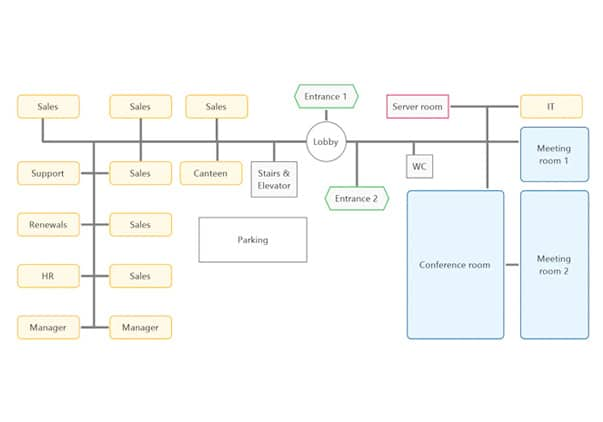
A mental map represents a person's perception of their surroundings.
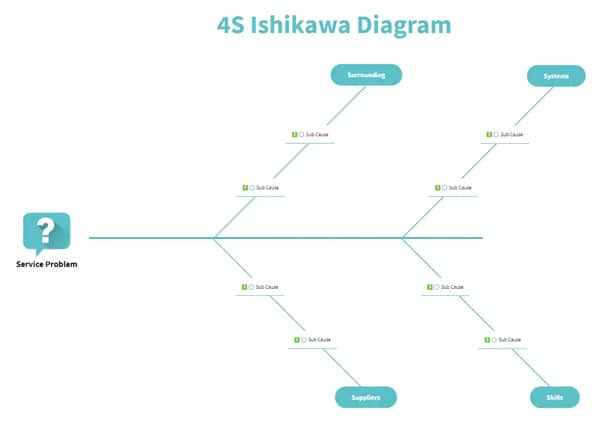
An Ishikawa diagram is designed to show the potential causes of a specific event or process.
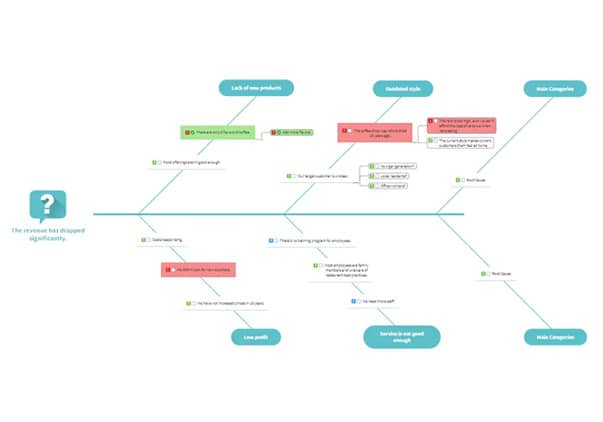
A fishbone diagram is a visualization tool used in business to identify and investigate the many possible causes of a particular event.
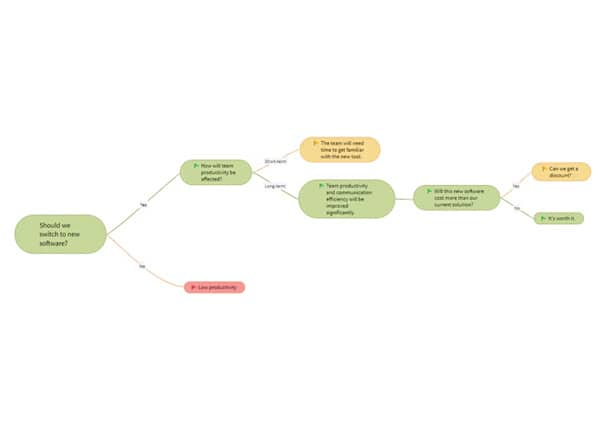
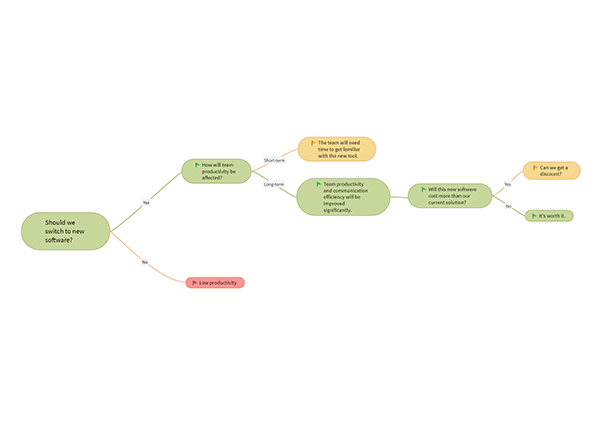
A decision tree is a type of flowchart you can use to visualize a decision-making process.
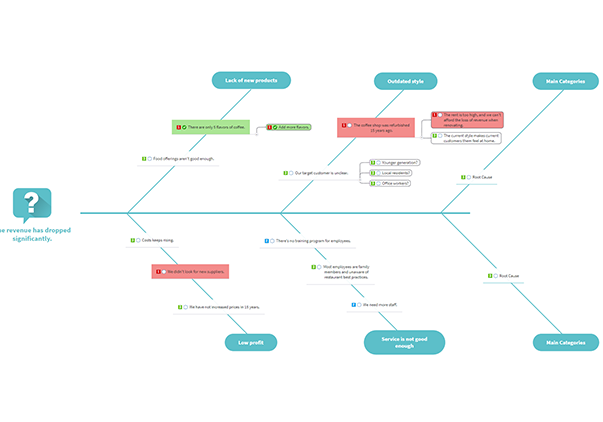
A cause and effect diagram (also known as Ishikawa, fishbone, or tree diagram) presents the causes of the root problem.

A SIPOC diagram is used in business to provide a high-level representation of a process to show how you can improve it.
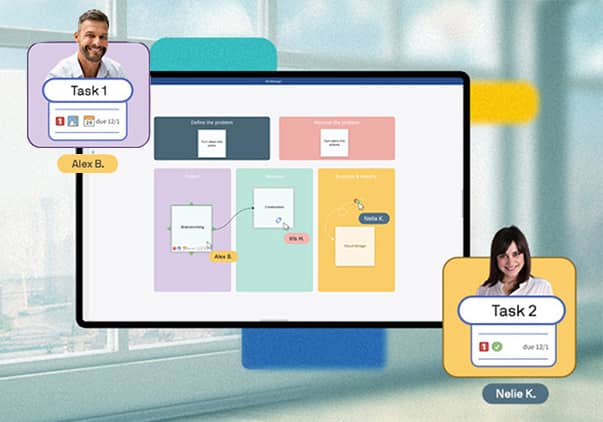
Brainstorming and collaboration made simple with whiteboard templates
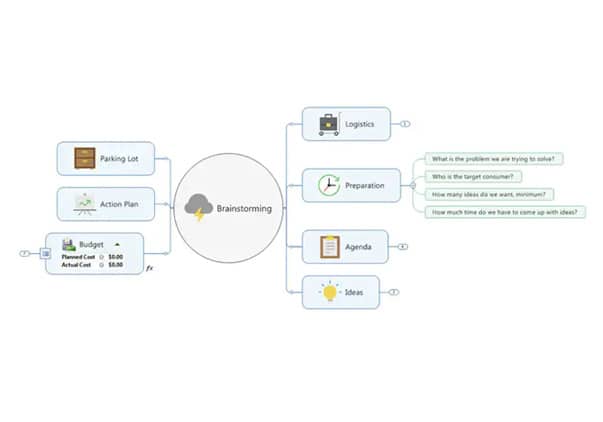
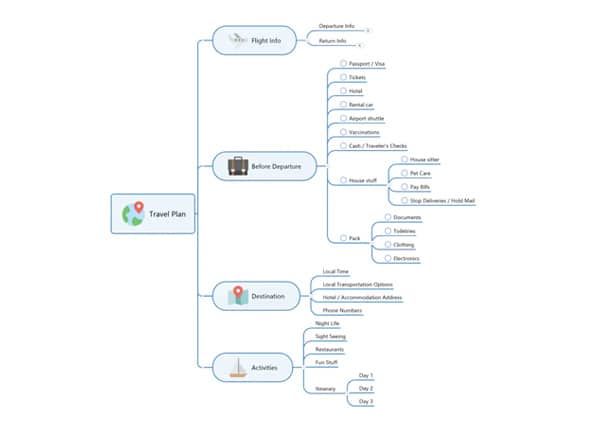
A mind map is a non-linear visual diagram that organizes and links the concepts related to a particular topic.
A bubble map is a visual representation of a noun surrounded by adjectives that can be used to describe it.
A spider diagram organizes and displays data in a logical, visual way.
An idea map is a visual representation of your thinking process.
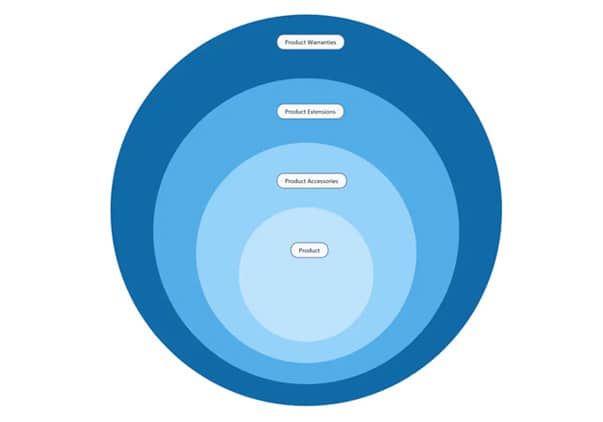
An onion diagram is a chart that shows the dependencies and relationships between the different parts of a process or organization.
A tree diagram allows users to visualize possible outcomes and probabilities for a given situation.
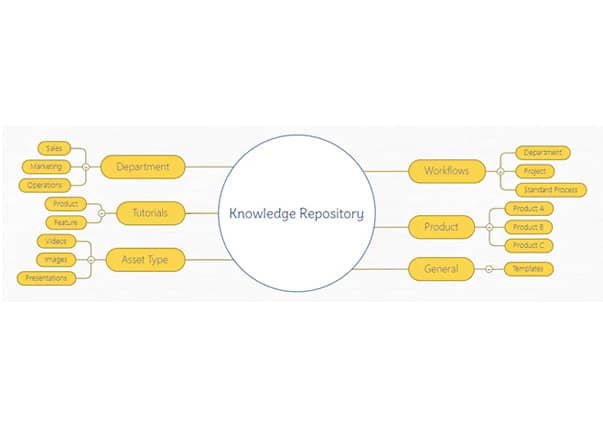
A knowledge map is a visual aid that shows where knowledge can be found within a group.
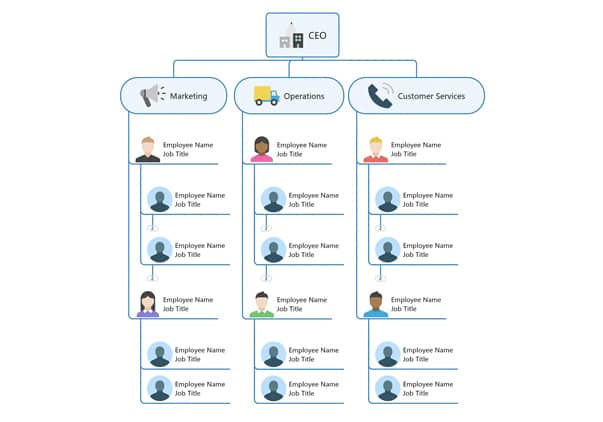
An organizational chart is a visual diagram that shows how work flows through an organization.
A web diagram is a visualization of how things are connected.
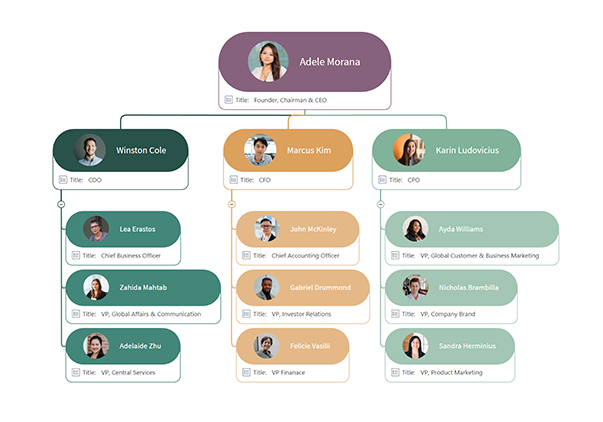
A functional chart (or org chart) organizes workers in a business based on skills, expertise, and specialty.
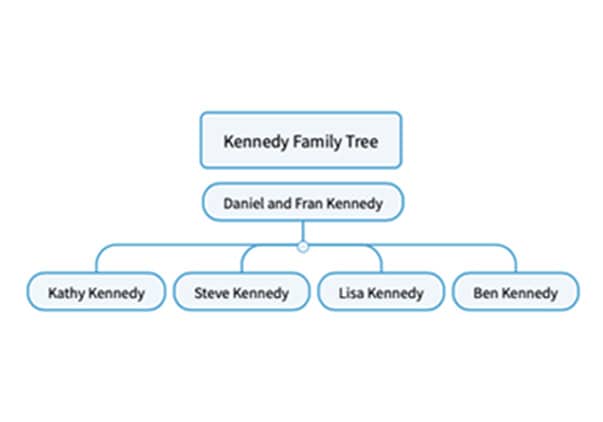
A family tree diagram is a visual representation that shows the relationship between family members, including stepparents, grandparents, siblings, and other relatives.
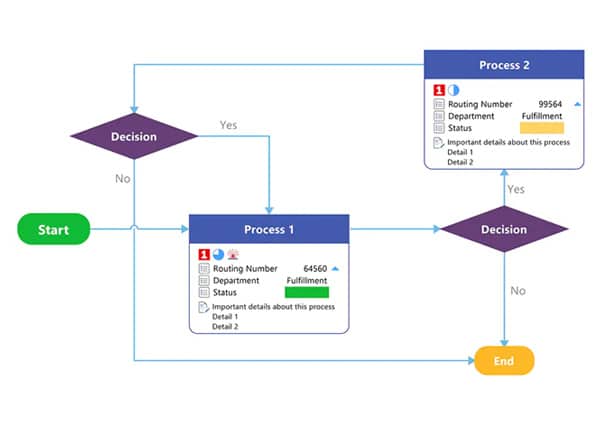
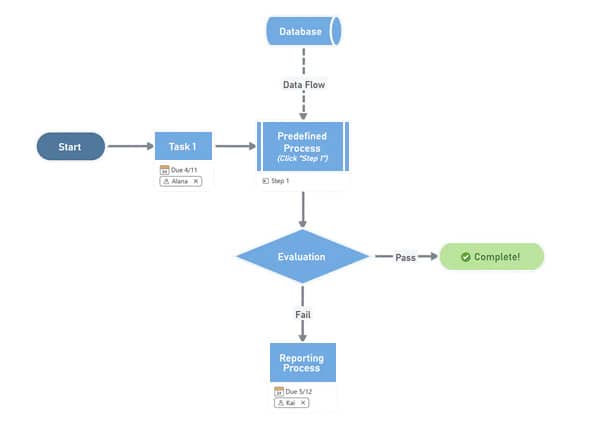
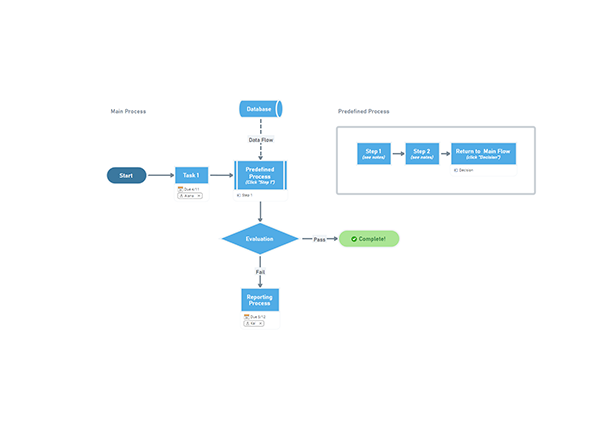
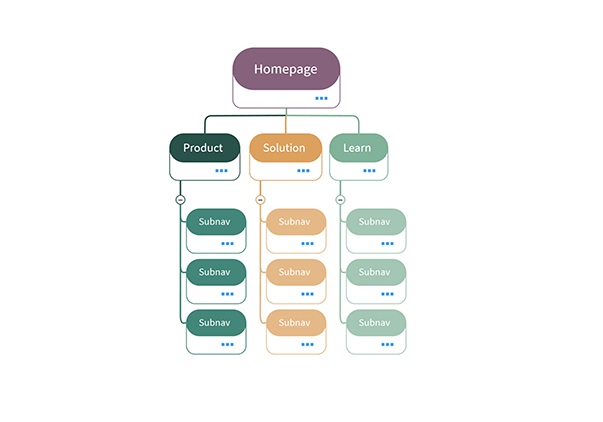
Flowcharts are a visual representation of processes or workflows.
Workflow diagrams visually represent a business process, project, or job.
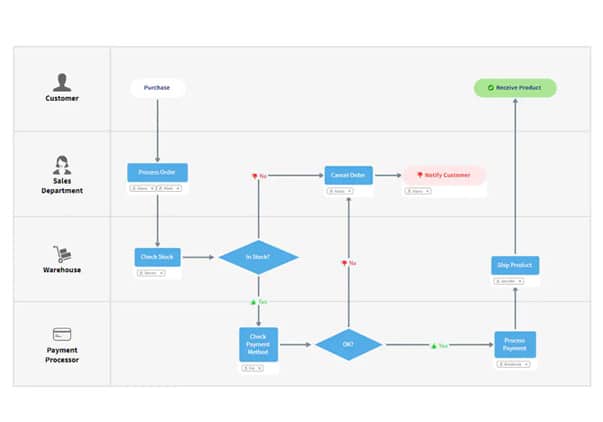
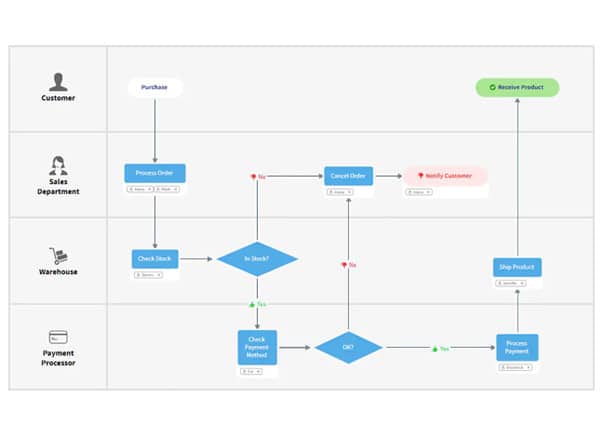
Swim lane diagrams are flowcharts that show a process from start to finish.
A process map is a visual representation of a task, process, or workflow.
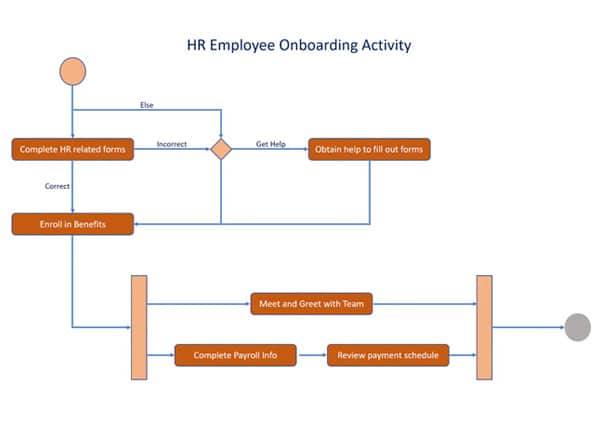
An activity diagram is a type of UML flowchart that shows the flow from one activity to another in a system or process.
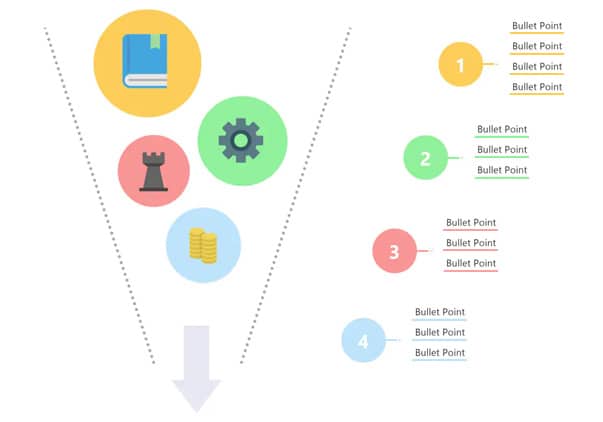
A funnel chart demonstrates data flow through a linear, sequential process within a sales pipeline.
A customer journey map is a visual tool that illustrates a customer's experience with a business from the moment they start interacting with the brand to the end of their journey.
User flow diagrams are visual representations of the steps a user takes when interacting with a website or mobile application to complete a task.