Use our fishbone (also known as Ishikawa) diagram template A structured brainstorming tool to unravel root causes and help you make effective decisions faster


MindManager makes it easy to unlock the power of cause and effect or fishbone diagrams with improved collaboration, easy sharing, and customizable templates. MindManager tools include.
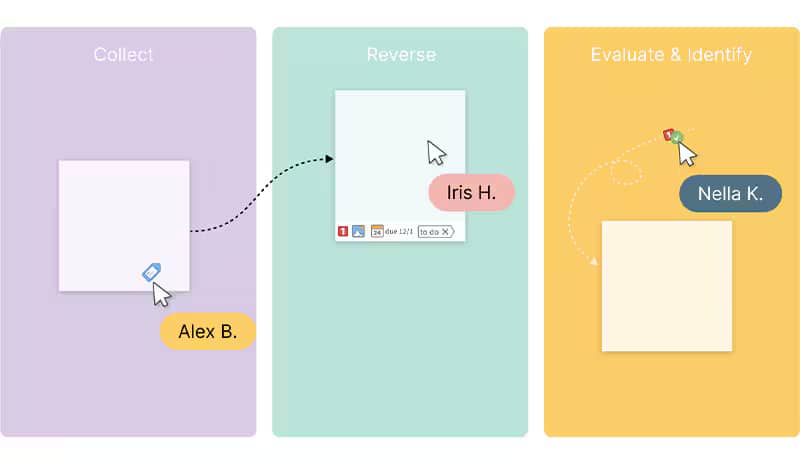
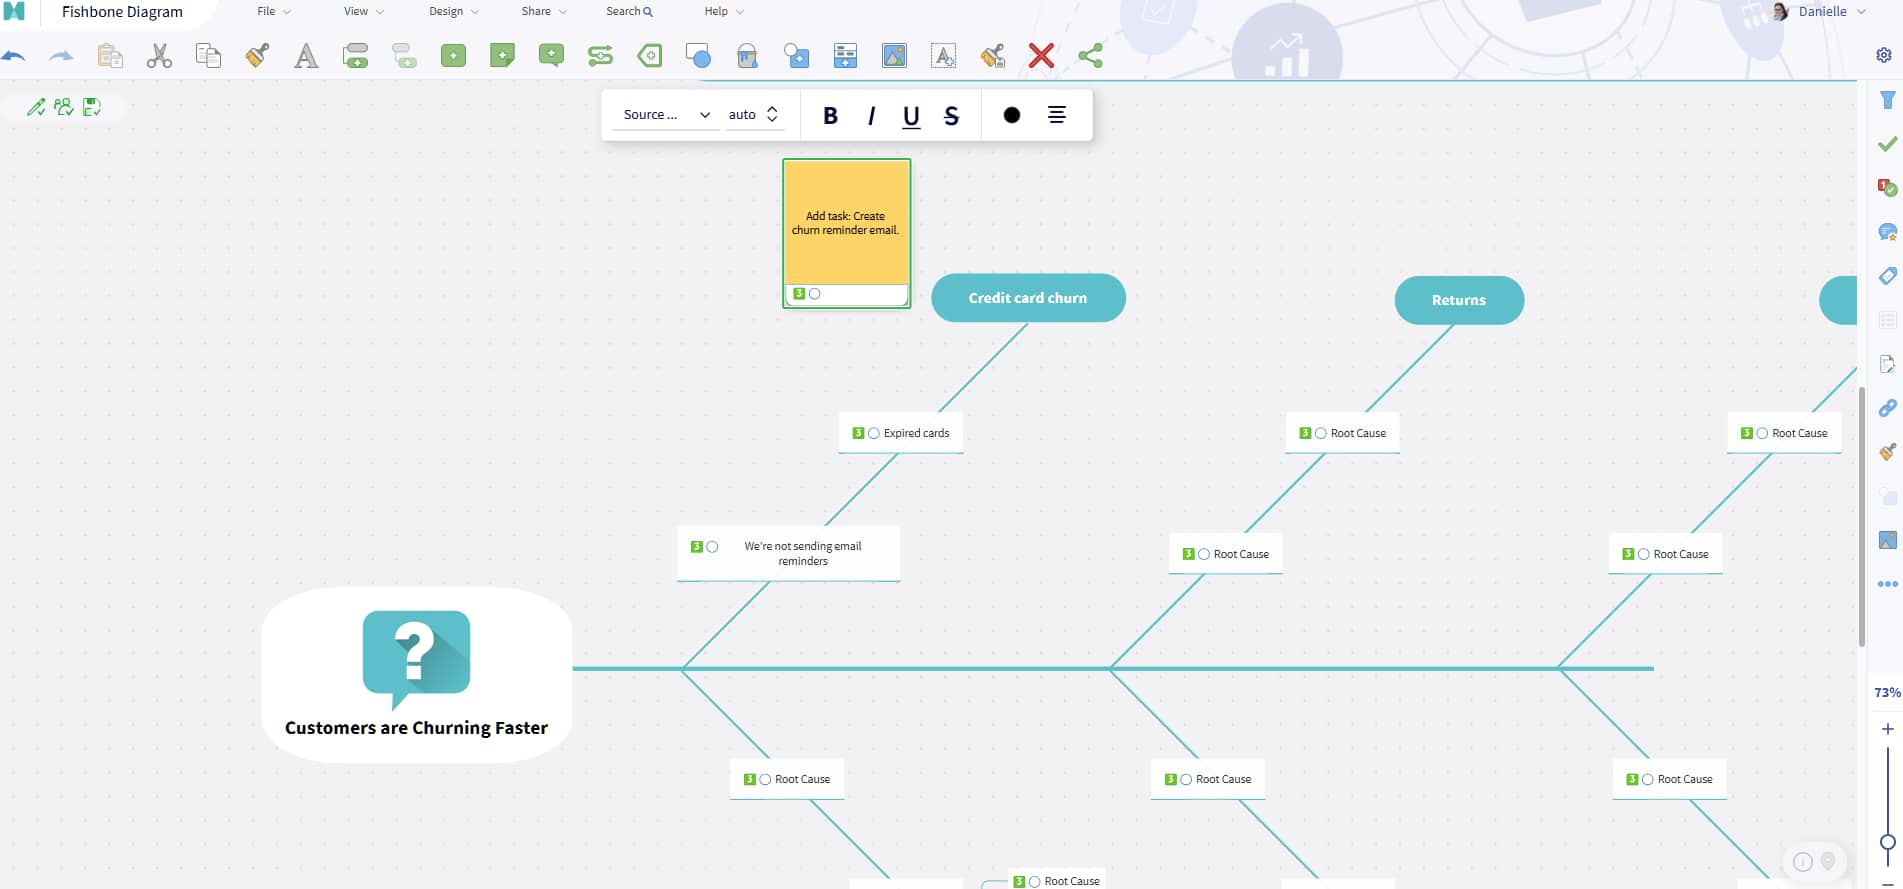
Use our virtual sticky notes to highlight important information, add context to complex concepts, or include callouts. Users can customize their sticky notes, making it faster to see who is commenting across charts.
See sticky notesNobody said your fishbone chart needed to be boring! Add text, icons, boxes, and other features to your chart to improve visualization and help bring your diagram to life.
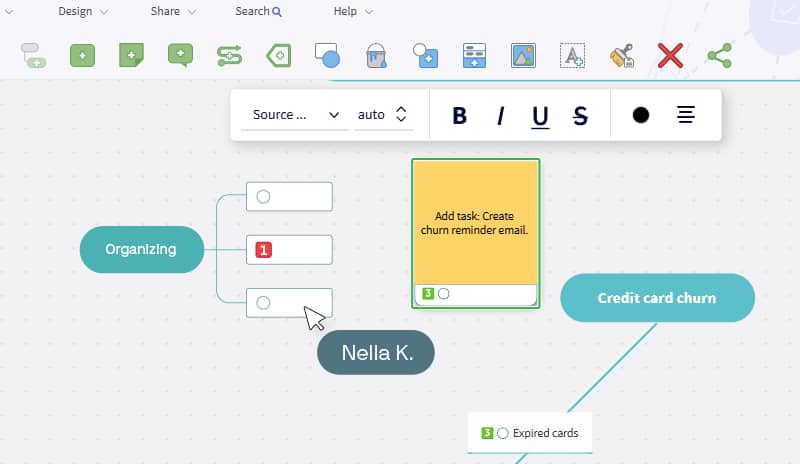
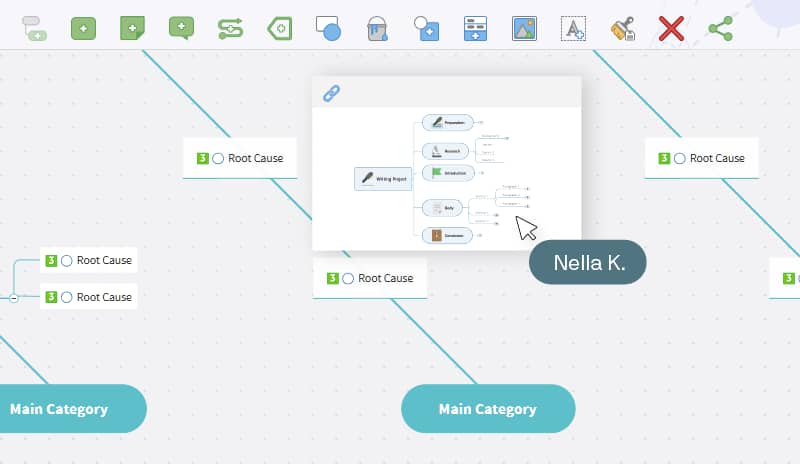
MindManager makes brainstorming, analyzing data, and finding challenges easier. Link your brainstorming session to your fishbone chart and your project planning map—or any other map—to keep documents organized and easy to find.
Quickly add resources or tag collaborators using the @ or # symbol to pull up a list of people or resources. Type, click, and put your project in the fast lane.
4.5 stars based on 565+ reviews
“The main benefit is that we can use MindManager to help us think through all the functions so that nothing is missed when developing a visual representation.”
“I like being able to show data and information in a visual way to share with colleagues or for presenting.”
“Great tool for brainstorming, planning, and organizing thoughts.”
An Ishikawa diagram, which you also might hear called a fishbone or cause and effect diagram, is a visual tool used to identify and analyze the root causes of a particular problem or effect. This diagram resembles the skeleton of a fish, with the main problem at the head and potential causes branching out like bones along the spine. You can easily create a fishbone diagram with MindManager templates, including.
Ready to start creating your own fishbone diagram? Here’s how to get started:
If you already have an account, sign in. If you’re new to MindManager, sign up for an account and we’ll let you try it out for free for 30 days.
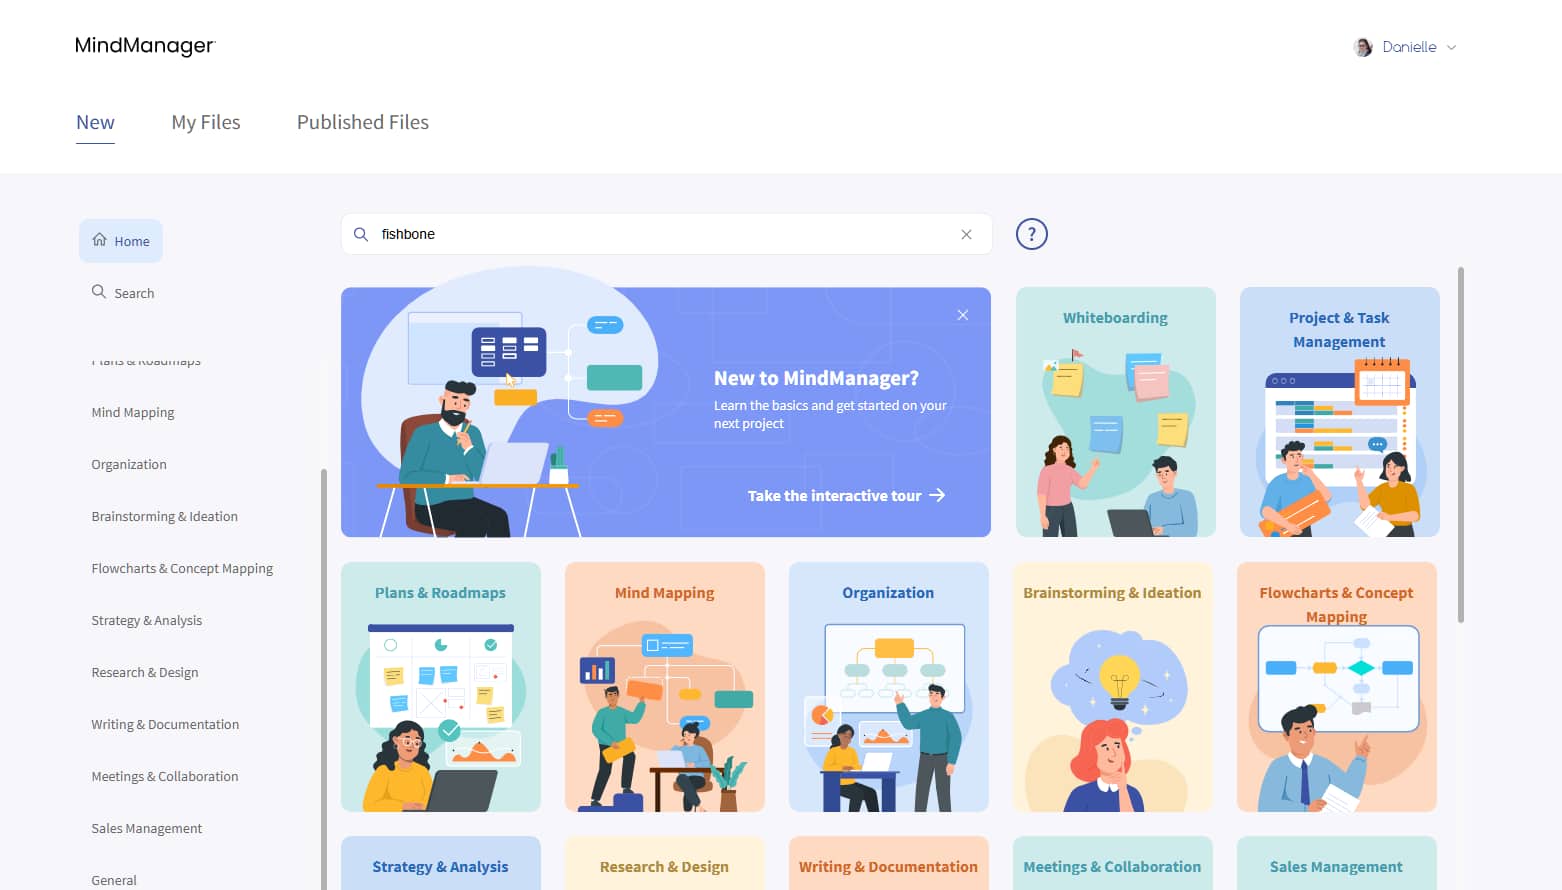
Use the search feature or scroll through our template library to find the template that fits your needs. Choose from fishbone, Ishikawa, cause and effect, or dozens of other templates.
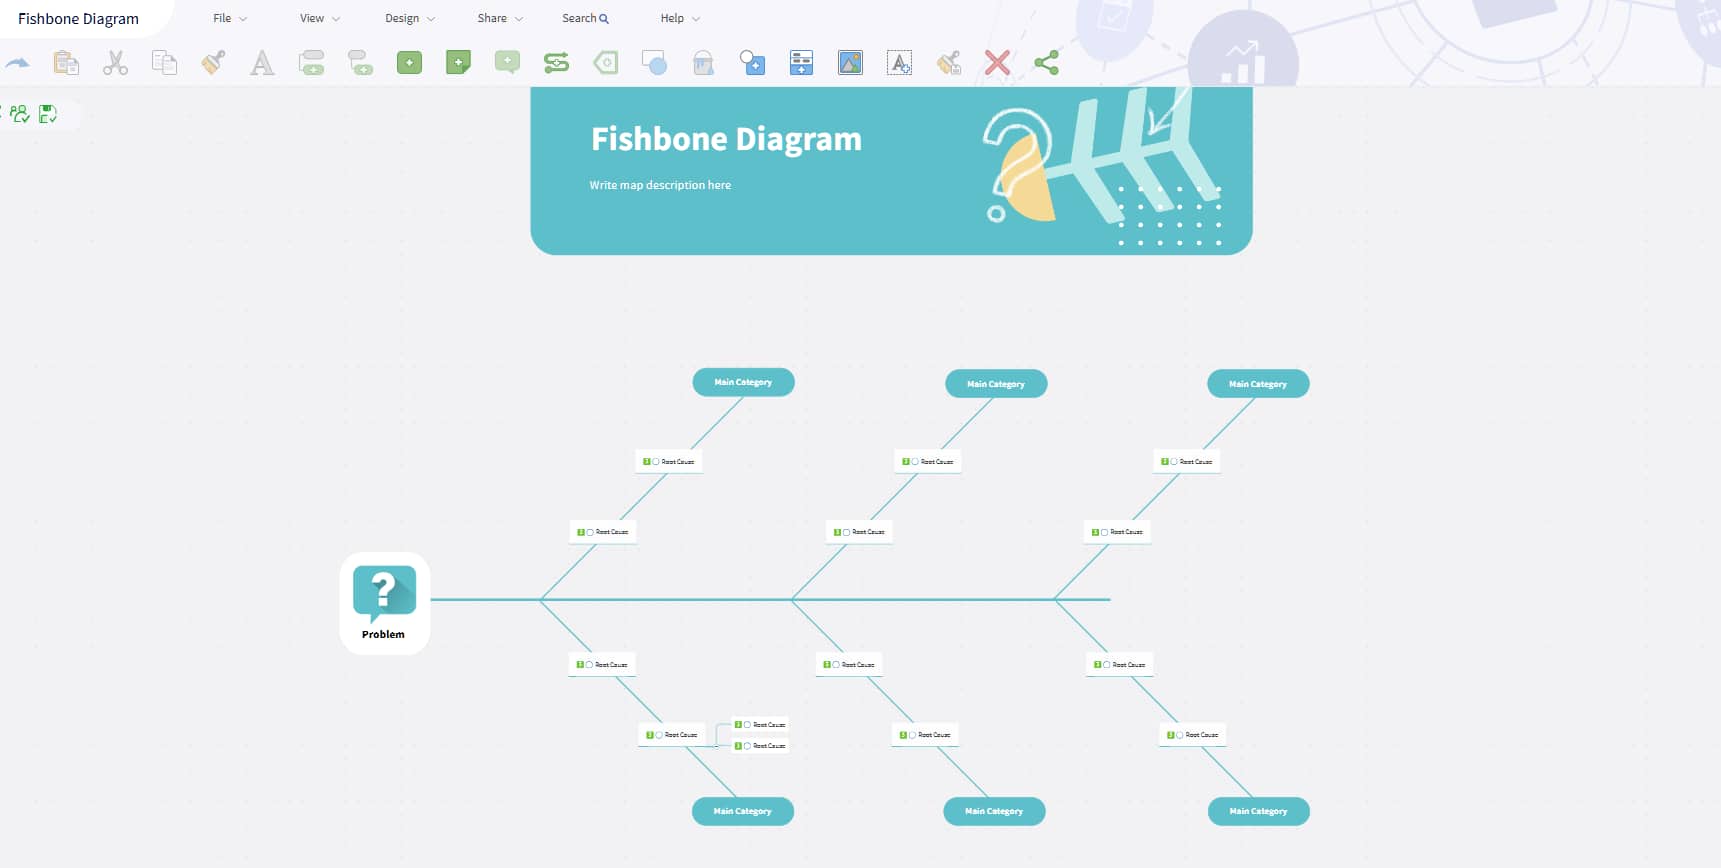
Each of our templates comes pre-filled with example text and images. Keeping the text means your new diagram will look exactly like the image in the template. If you uncheck the “Keep Example Content” box, your diagram will look like this:
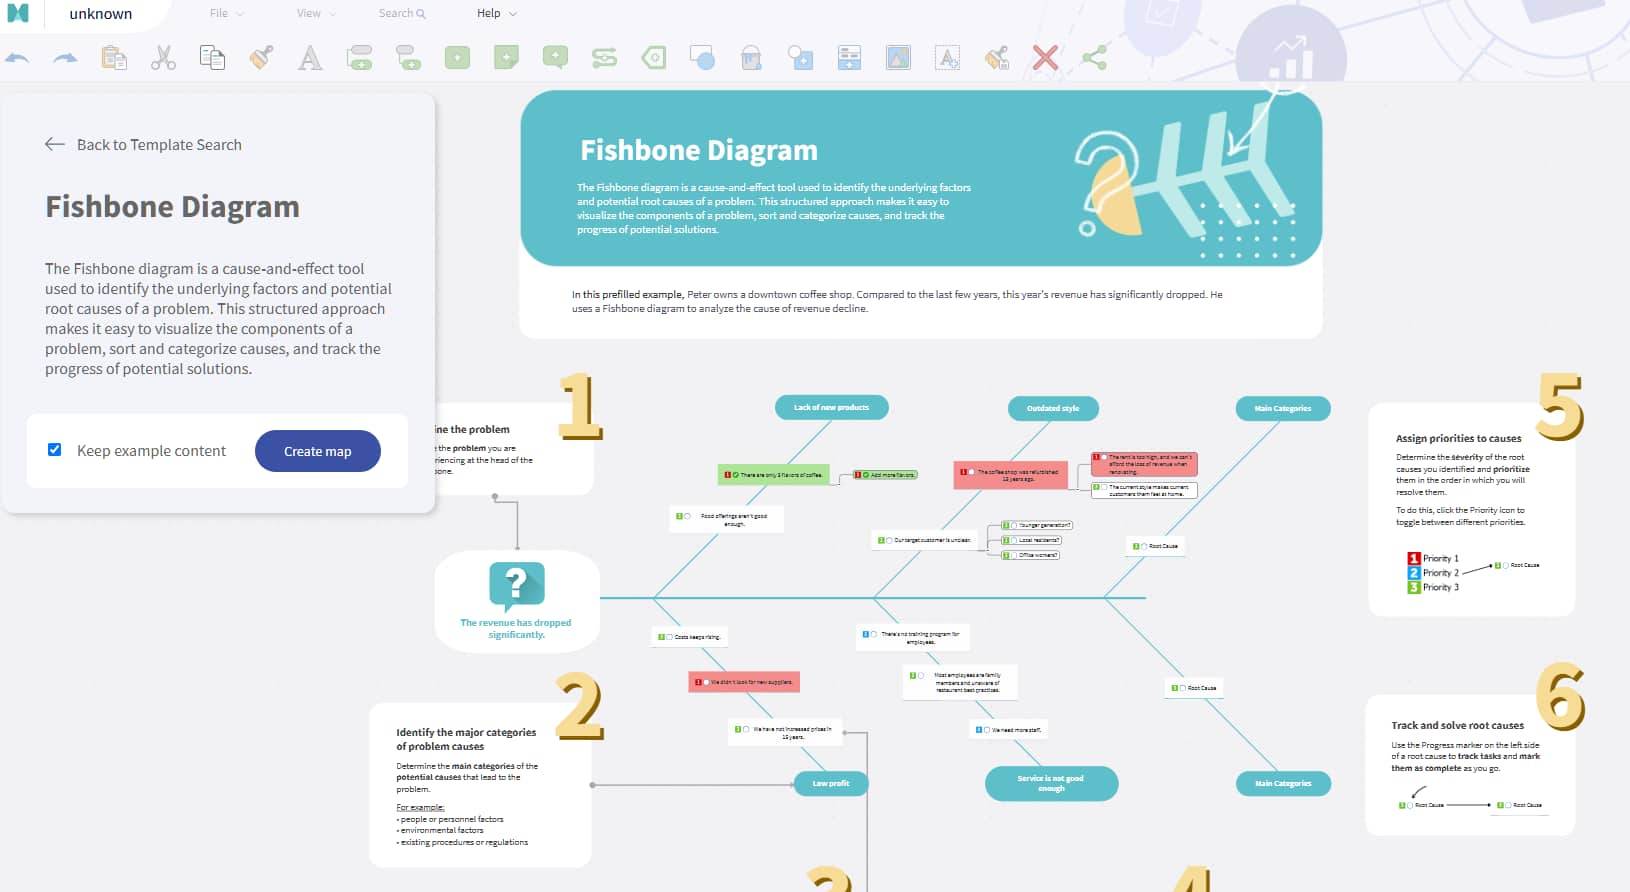
If you keep the example content, your diagram will look like this:
There’s no right or wrong choice; just choose what works best for your situation!
Now, it’s time to start customizing your diagram. Start by adding the main challenge at the “head” of the fish, then the main categories to the spine. Use the 5 Whys or 6 Ms framework to determine the root cause of each challenge.
Add sticky notes, images, files, and pictures as needed to make your diagram as useful as possible.
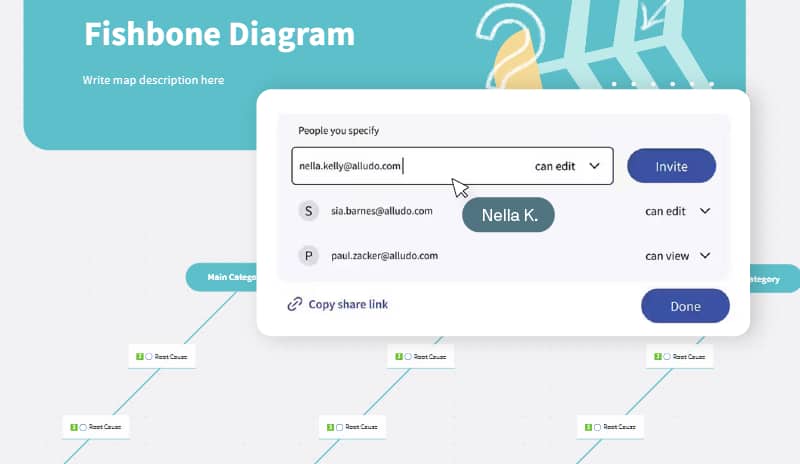
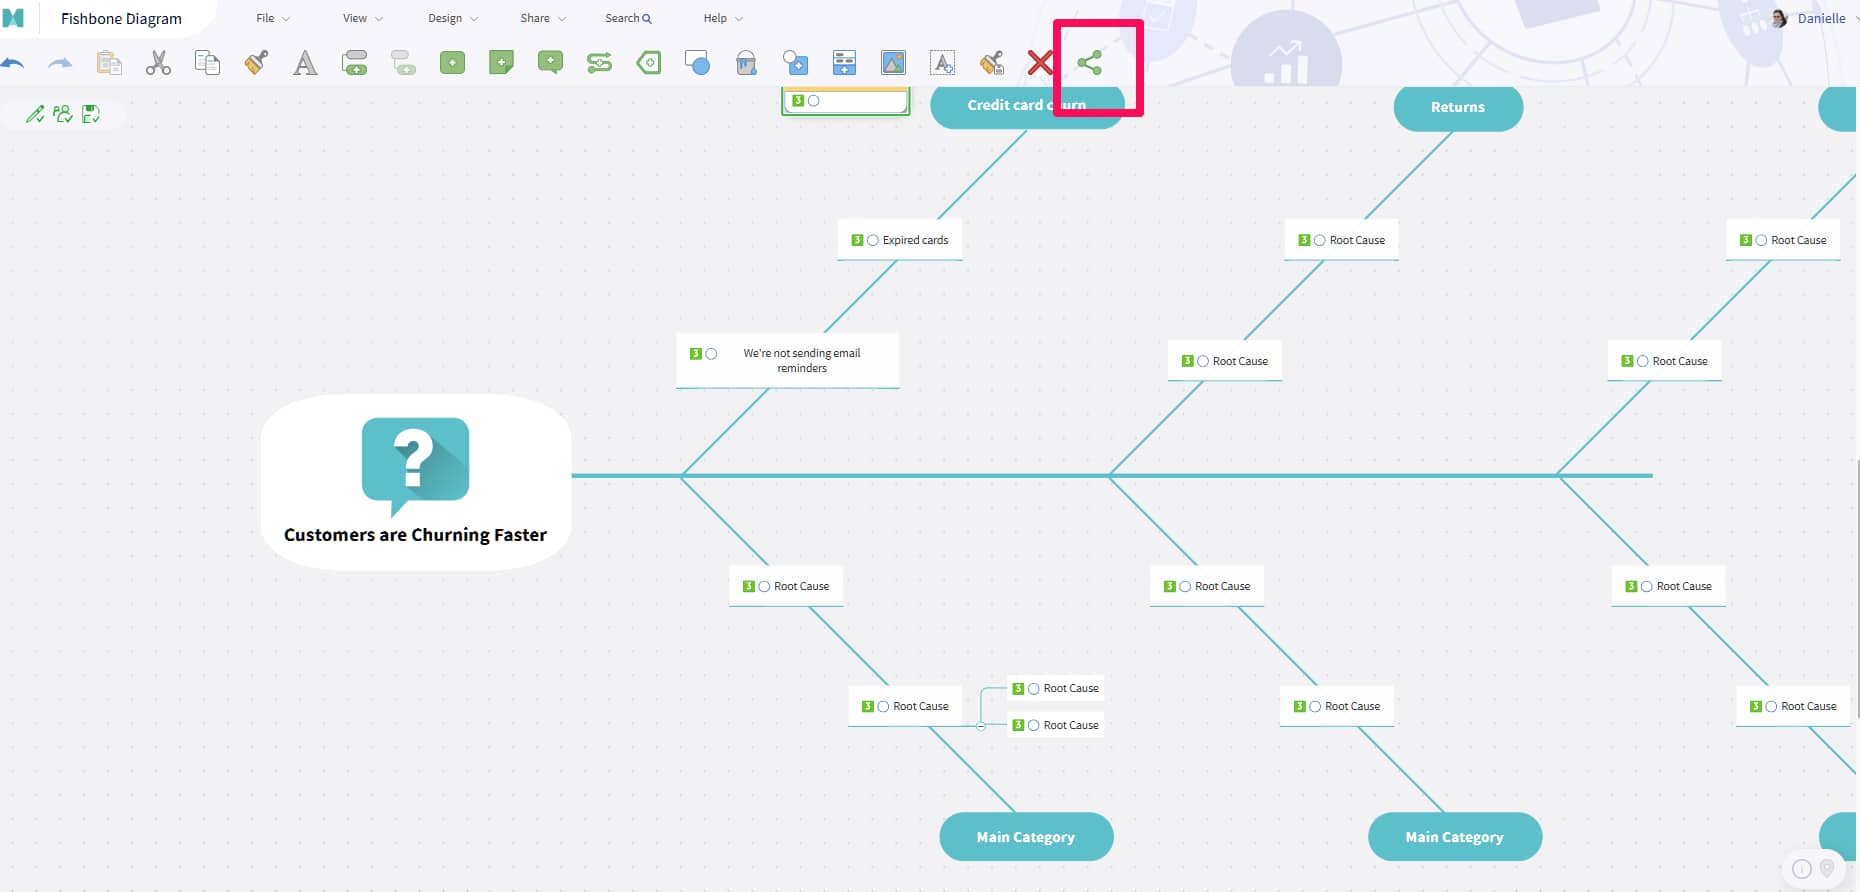
MindManager doesn’t just help you create charts – we also make collaboration easier. Users can easily share diagrams and adjust access levels so your team can see, edit, or comment on your charts.
Click the share button in the navigation bar and adjust the settings to fit your needs.
That’s it! Go forth and create your own fishbone, cause and effect, or Ishikawa diagram and share them with your team. Use them in strategy meetings, share with team leads, or use them to track your own thought processes.
Explore the many ways fishbone diagrams can help your team solve problems and drive innovation.
The Murau brewery is dedicated to quality, sustainability, and innovation. They rely on MindManager for everything from meeting management to managing machine spare parts.
Learn moreFishbone diagrams are a useful way to explore new ideas, find the root cause of an issue, or explore complex ideas. Below, we’ll answer some of the most common questions about these charts and how to use them.
Ishikawa and fishbone diagrams describe the same visual chart used to identify and analyze the root causes of a problem. The name "Ishikawa" honors the creator, Japanese organizational theorist Kaoru Ishikawa, and "fishbone" describes the diagram's shape. A rose by any other name smells just as sweet!
It is worth noting that each diagram might use a slightly different strategic framework. The fishbone diagram uses the 5 Whys or 7 categories, while Ishikawa uses the 6 M model.
The 5 Whys fishbone diagram is a problem-solving strategy that combines the traditional fishbone diagram with the 5 Whys technique. This approach helps identify the root causes of a problem by repeatedly asking "why" for each identified cause until the underlying issue is discovered.
Adding in the fishbone diagram helps visually organize the causes, providing a structured method to drill down into each contributing factor for a comprehensive analysis. Here’s a simple example to illustrate how it works:
The problem: The project deadline was missed.
The 5 Whys help highlight issues and challenges that might seem unrelated to the original problem at first glance.
The 6 Ms of the Ishikawa diagram represent six common categories of potential causes contributing to a problem. These categories help organize your analysis and ensure all considerations are covered. They are:
Like the 5 Whys, the 6 M model provides a framework to ensure users consider all possible factors.
TLike the 5 Whys and the 6 M framework, the 7 categories are a framework to ensure you consider all possible potential problems and their sources. The 7 categories are an updated version of the 6 Ms and include:
The 5 Whys help highlight issues and challenges that might seem unrelated to the original problem at first glance.
Fishbone diagrams use a strategic approach to ensure your team considers all the factors that could impact important business decisions. Whether you’re launching a new product, kickstarting a new marketing effort, or looking to understand why your customers are churning, fishbone diagrams improve self-reflection and drive innovative thinking.