MindManager's timeline templates help teams plan and manage date-based projects more efficiently.
Looking for an enterprise plan?


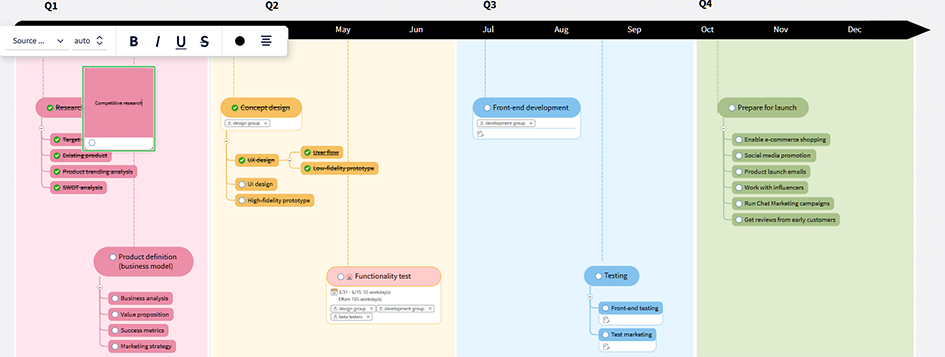
A timeline chart illustrates a series of events, tasks, or milestones in chronological order. They're an excellent tool for conceptualizing event processes and gaining insights into a project's nuances. MindManager offers powerful features for timelines.
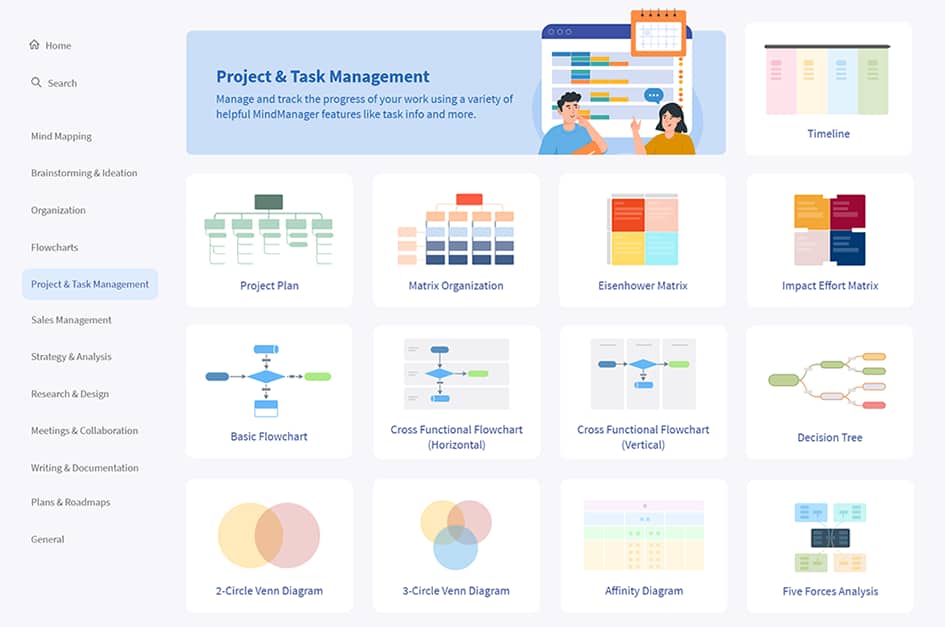
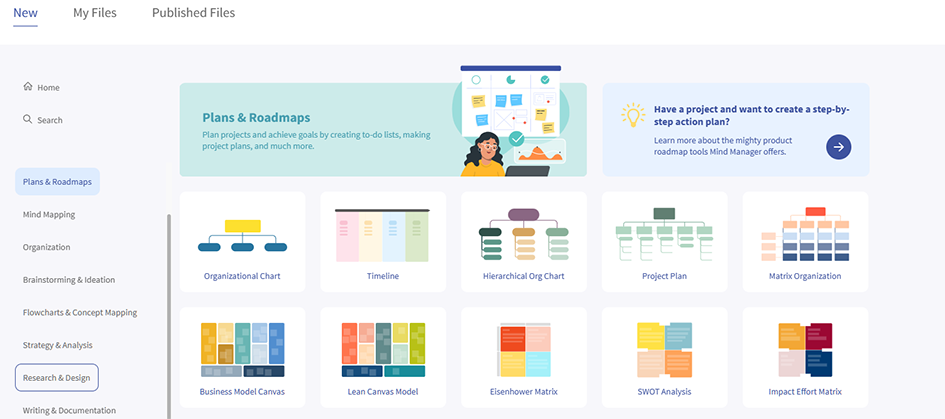
MindManager templates allow you to select the timeline format that works best for your team, including Gantt charts, timelines, process mapping, and more.
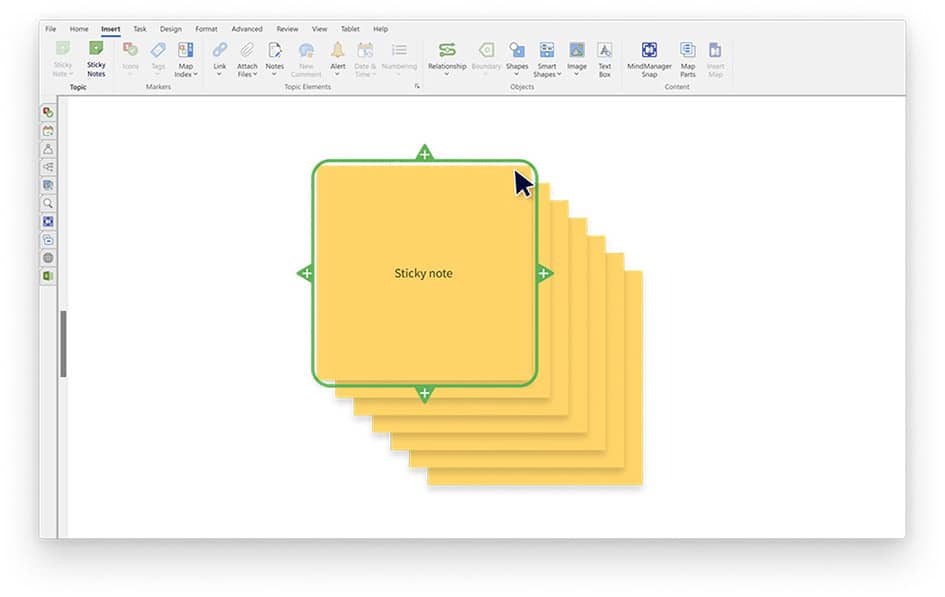
See templatesAttach sticky notes to draw attention to essential steps in the process, tag users, share resources, or call out potential pitfalls.
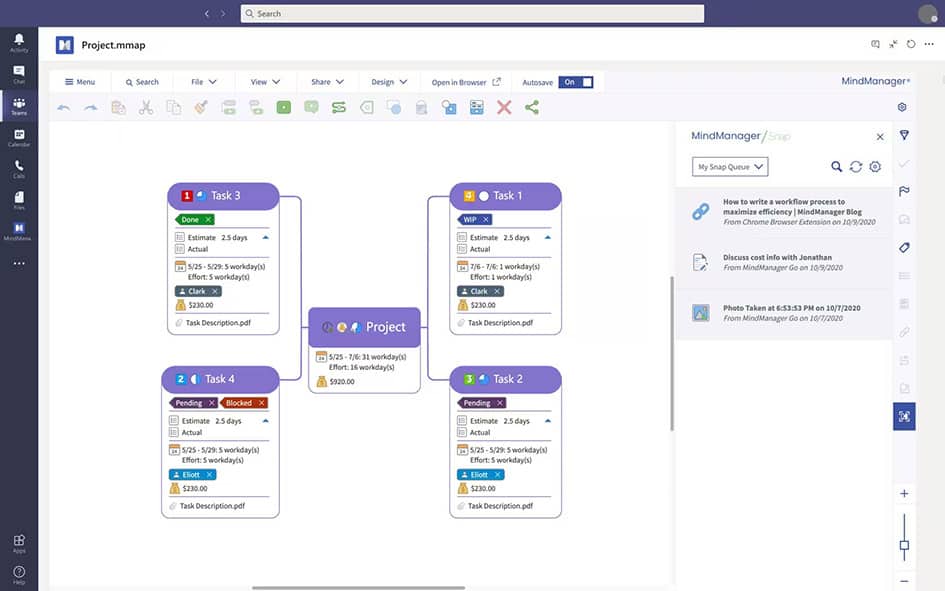
See sticky notesTurn goals into plans by assigning tasks to specific users, tagging colleagues for more information, or adding due dates.
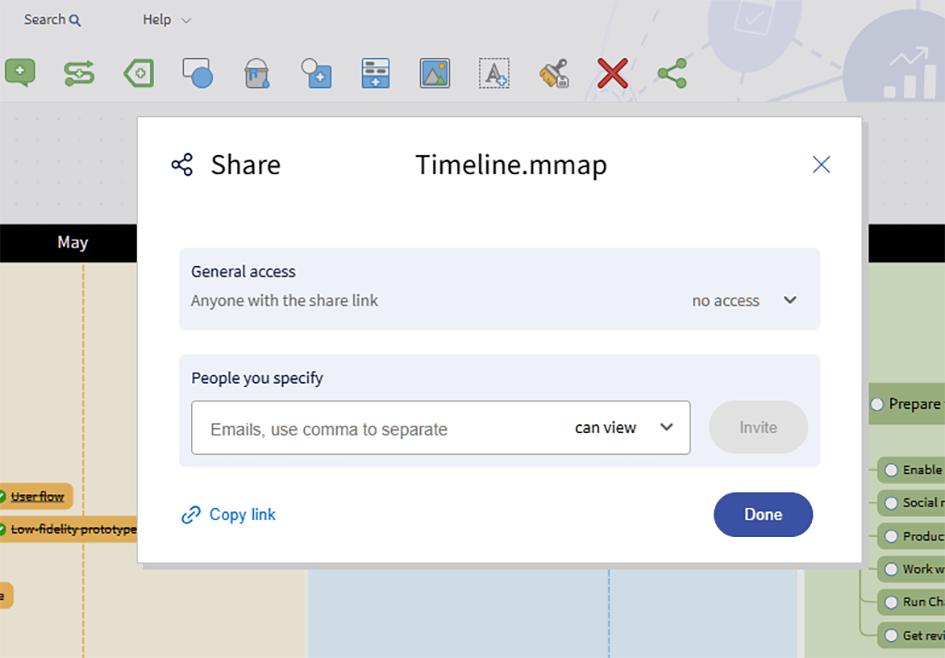
Connect timeline templates to your favorite work tools for seamless project management. MindManager integrates with dozens of tools, including Jira, Dropbox, and OneDrive.
See integrations4.5 stars based on 565+ reviews
Don’t just take our word for it! Real users cite how MindManager enables them to drive conversations, illustrate their processes and workflows, and is a highly effective, easy-to-use communication tool.
“Great software for planning and laying out processes.”
“MindManager really creates an amazing visual flow of a work product, org chart, or whatever is being created.”
“The industry leader in ideation and collaborative brainstorming.”
A Critical Path Method (CPM) chart identifies a project's most extended sequence of tasks. It helps ensure timely completion by highlighting functions directly impacting the project's timeline.
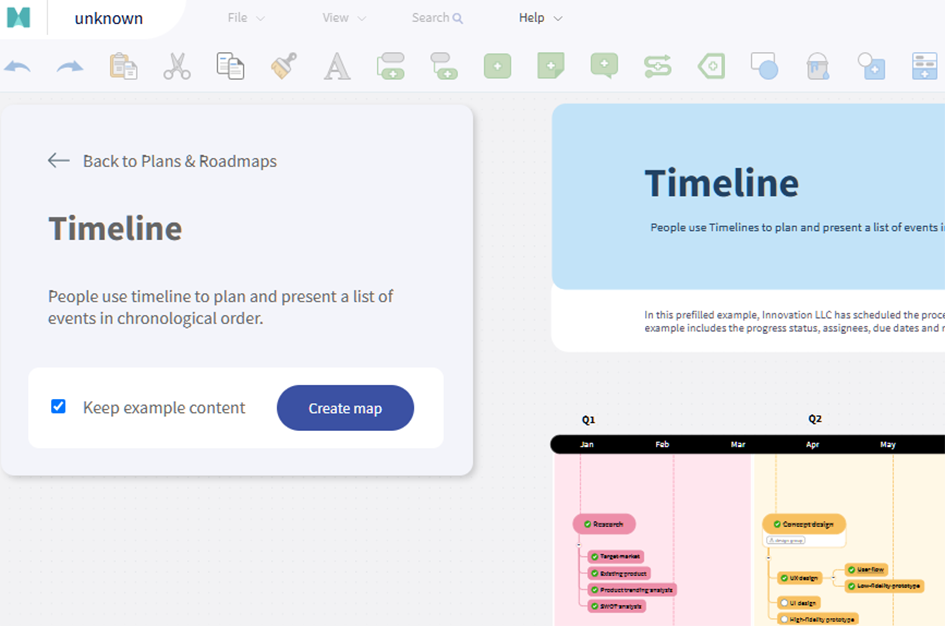
Get templateThis time-based chart arranges events, tasks, or milestones in chronological order, making it easy to understand the sequence of events in a specific time period.
Get templateA Gantt chart is a horizontal bar chart illustrating a project schedule, showing start and finish dates, dependencies, and progress.
Get templateOnline timeline charts make it easier to visualize project timelines, track progress, and manage tasks efficiently. With MindManager, you can customize timeline charts in just a few minutes.
Templates come prefilled with text to help you get started. Unchecking the "Keep example content" box preserves the structure but removes the text.
Choose the best option, then tap "Create Map."
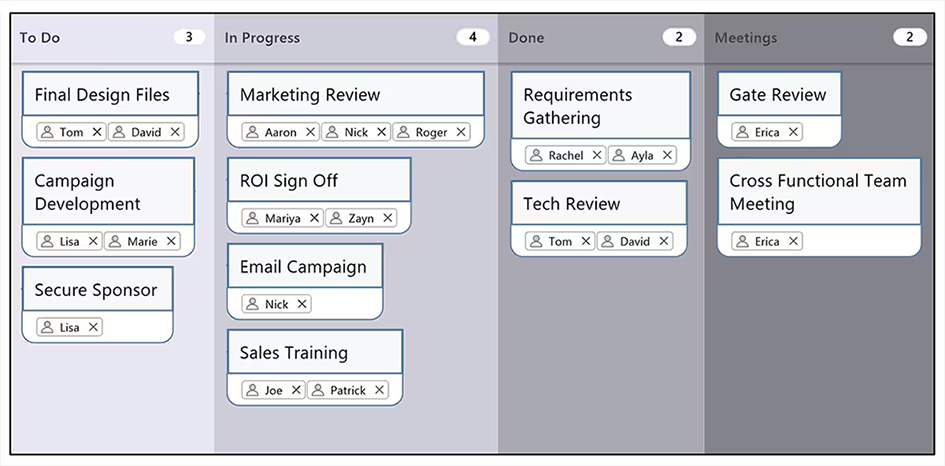
MindManager helps project managers keep their teams on track. Use our templates to plan short or long-term projects, assign tasks, send resources, and track progress.
Learn moreClosing deals requires staying organized. Use MindManager to track the progress of large deals, collaborate, and ensure hot prospects are given the attention they need to close.
Whether you're updating your SEO, launching a new partnership program, or ensuring a smooth product launch, MindManager can help. Use timelines to map out steps, assign tasks, and more.
Learn moreProduct teams have a lot to juggle — and a lot of collaborators. Use MindManager to plan your next sprint, map next quarter's deliverables, or brainstorm new features.
Learn moreUsing MindManager, their clients can see projects taking shape in real time. By standardizing the project process, Syllogistic Management Solutions can save time, streamline projects, and provide clients with tangible results faster.
Learn moreTimelines are an effective way to map out project timelines and keep your team on track.
Here's more information to help you get started.
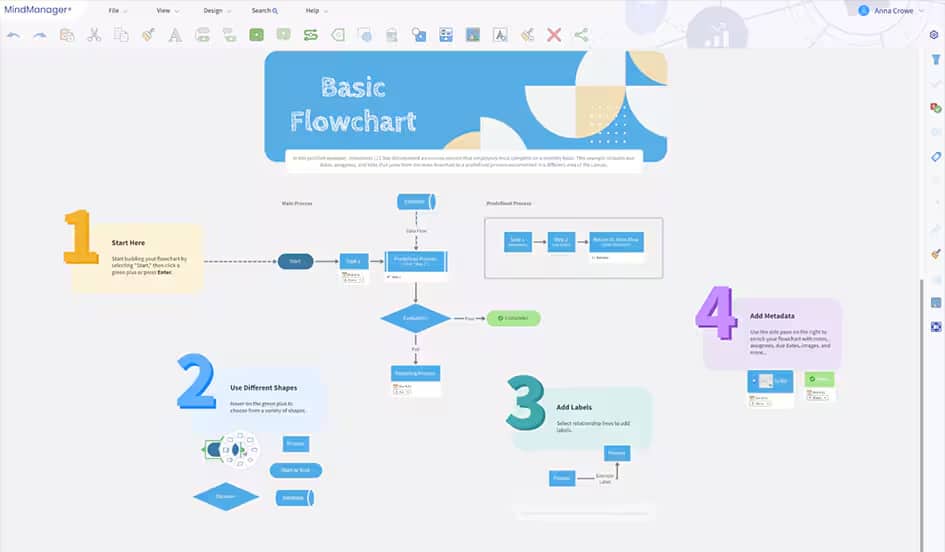
Open MindManager and select a template or start with a blank whiteboard. Add each step in your process, assign tasks, and attach resources.
Our timelines are fully customizable, so there's no right or wrong way to get started.
Start by listing all the steps in the process you're looking to map. Add due dates, assignees, and prioritization.
Then, select an element to represent each step. You might choose to use the same element (say a yellow triangle) for each step or vary the elements by type — maybe marketing's steps are in blue while the product team's tasks are in green.
Then, attach any documents or resources needed to complete the step. When each task is completed, check it off. This will provide a clear overview of your project.
There's not one "best" chart for timelines. The suitable timeline template depends on your needs.
MindManager's most popular chart is labeled "Timeline." However, Gantt charts and timeline infographics are also popular options.
Spend a few minutes reviewing each type before making your selection. Remember, you can always customize templates to fit your needs.
Timeline charts can save your team a significant amount of time and effort. By providing a clear visual representation of tasks and milestones, timelines streamline project planning and execution. Try MindManager today and see how the solution can help your team work smarter—and faster.