CPM, which stands for Critical Path Method, is an algorithm of resource utilization that schedules project activities. CPM is used to construct a project model that includes:
A CPM chart lets you schedule a series of activities that determine the total duration of a project. Teams working on the project should follow that sequence in order to successfully complete the project.
The advantages of using CPM charts are improved efficiency and accurate costing for a project.
By creating and using a clear and comprehensive CPM chart, you will be able to effectively manage your project and mitigate as many of the costs and issues as possible.
Create a CPM chart to visualize and scope project tasks with MindManager. Sign up for MindManager for 30 days free!
PERT focuses primarily on time management and achieving desired results as quickly as possible, whereas CPM typically focuses on both timeline and budget in order to bring in a project as quickly as possible within budgetary constraints.
CPM chart software allows you to calculate a project's time durations, determine individual task importance, and make a comparison between actual and planned progress in your project until it is complete.
CPM charts are often used by product managers when optimizing resource allocation to improve production timelines.
A number of business cases for using CPM charts are:
You should create a CPM chart at the beginning of the project when identifying the tasks that will need to be completed.
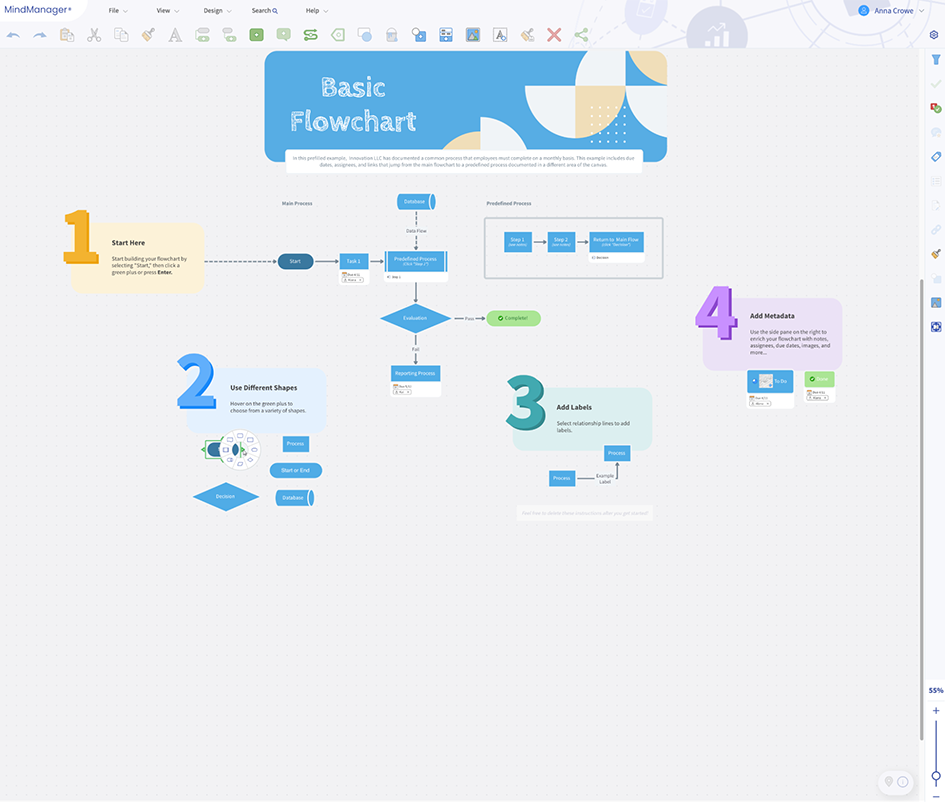
To make a CPM chart using MindManager, follow the steps below.
Sign in to your MindManager account.
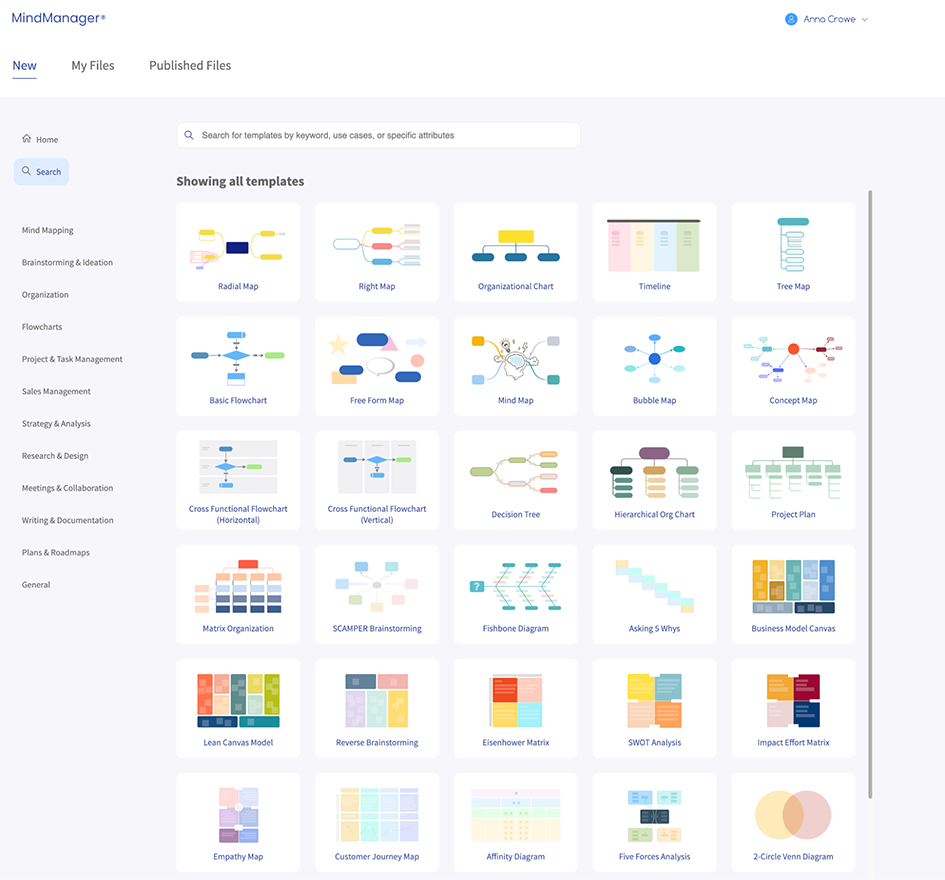
Choose from one of the MindManager templates. For this example, we are choosing the basic flowchart template.
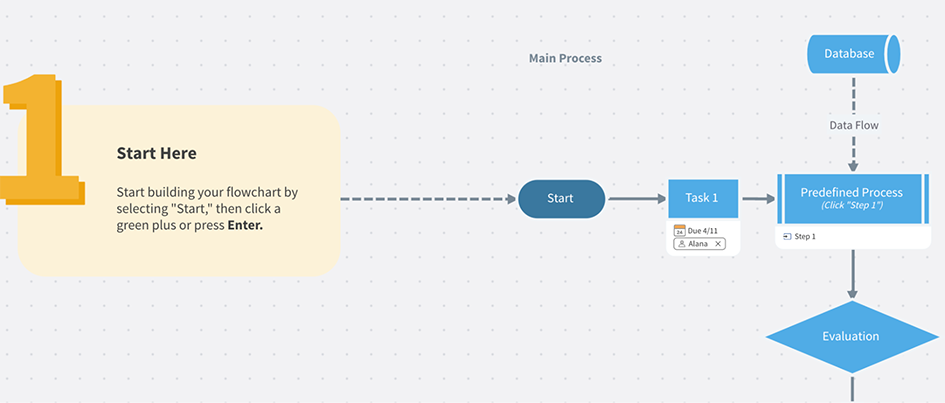
List the specific tasks. Begin by making a list of each specific task you anticipate as part of the project process.
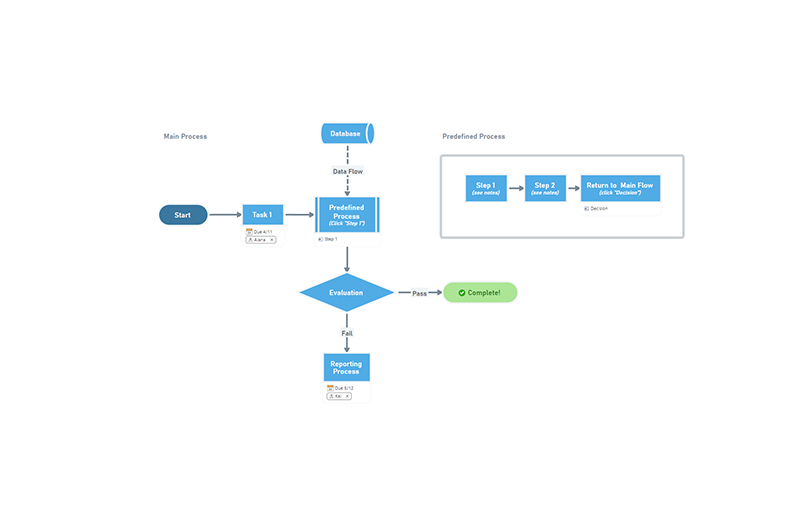
Put the tasks in order. Next, establish the correct sequence of tasks. Draw out a network diagram that shows these tasks in order.
Estimate the completion time. Write down the estimated task completion time between each task.
Identify the critical path. Now you can identify the critical path to navigate the project from beginning to completion and keep the CPM chart updated as you go to keep track of progress.
MindManager is a simple, accessible digital tool that enables you to create CPM diagrams in just moments.
MindManager uses algorithms to schedule critical tasks in order, determining individual task importance and comparing actual and planned progress in your project through to completion.
Using MindManager for your CPM charts will improve your communication with your team as you will be able to share projects with them directly — everyone will be working from the same system.
Planning projects effectively is the simplest and easiest way to prevent complications, delays, and expenses further down the line.
CPM diagrams are a useful, visual way to identify tasks and order them by importance, but writing them by hand can be laborious.
Instead, use a CPM chart manager tool like MindManager to create CPM charts in just a few clicks of a button.
Create a CPM chart to visualize and scope project tasks with MindManager. Sign up for MindManager for 30 days free!
Creating CPM charts in MindManager is easy and intuitive. Simply choose a pre-made template and follow our steps for making a flowchart. To get started making your own web diagrams, try MindManager free for 30 days.