Easily track project progress in real-time, keeping your team on task and your projects on time.


Gantt charts are easy to create — and customize.
Here's how to use project management templates from MindManager to create a Gantt chart.
Don't have a MindManager account? Try MindManager for free.
To use Gantt charts in MindManager, you’ll need to install MindManager for Windows or Mac. Once installed, open the application and sign in.
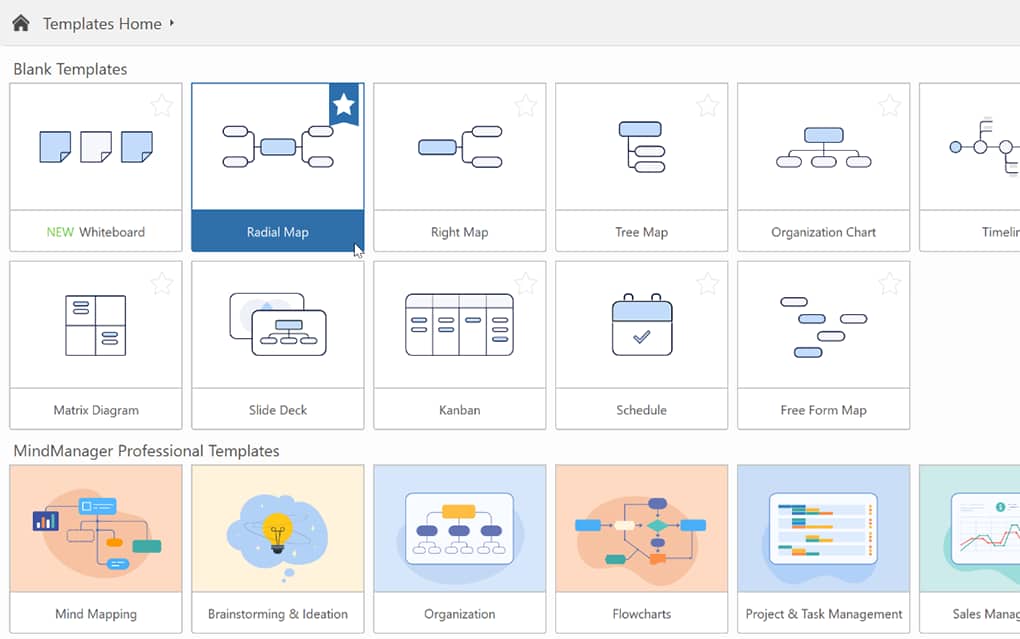
One of the most popular ways to build a project plan in MindManager is using the “Radial Map” template. Let’s start by choosing that.
The radial map functions like a virtual whiteboard, allowing you to add project details, notes, attachments such as PDFs, images, and reference material, as well as invite team members to collaborate.
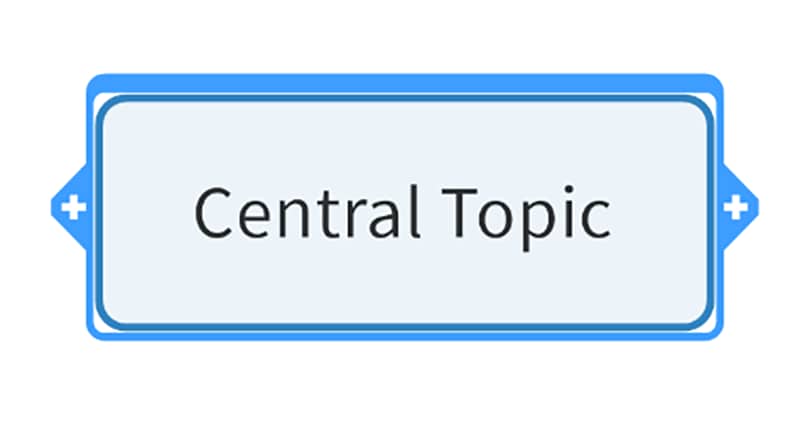
You will begin with a blank map showing only a central topic.
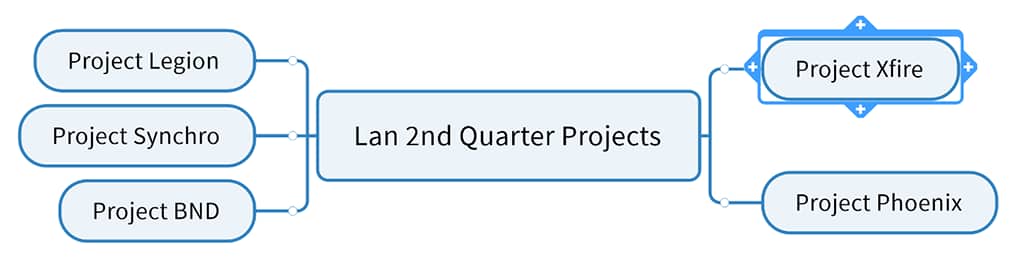
Rename your central topic, then add the names of your various projects. Later, you will add components of each project, followed by task information, due dates, milestones, resourcing, costs, priority markers, and more.
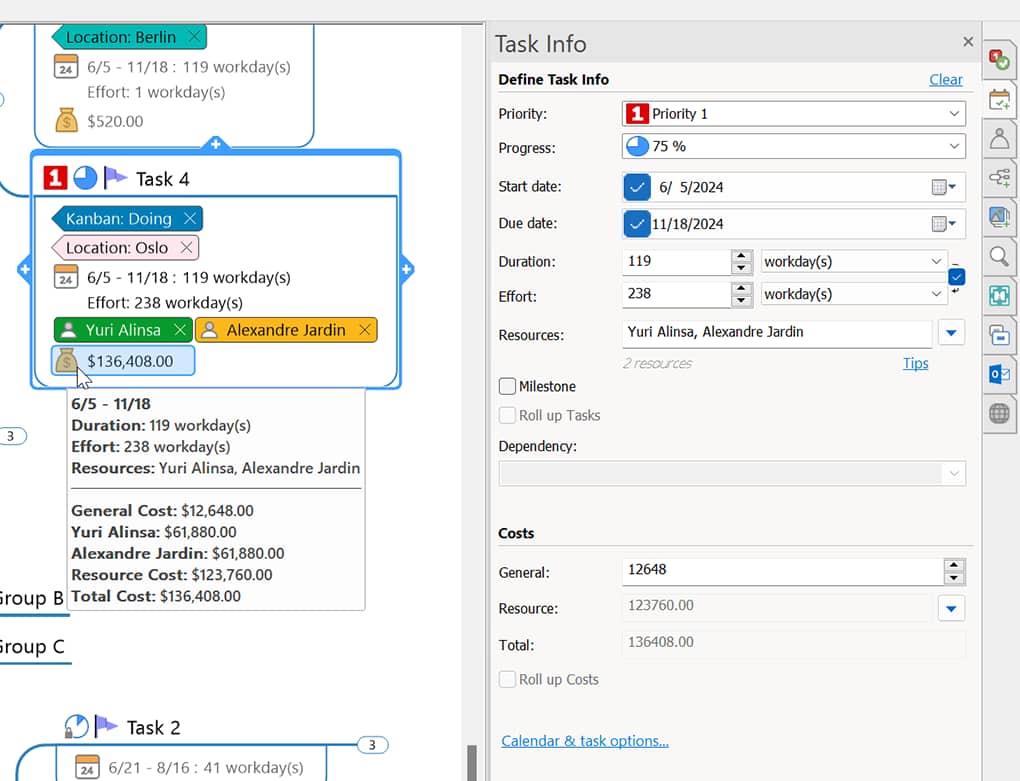
Now, it's time to make it yours. Open the Map Index and Task Info panes at the right of the main interface and add your project details for each task.
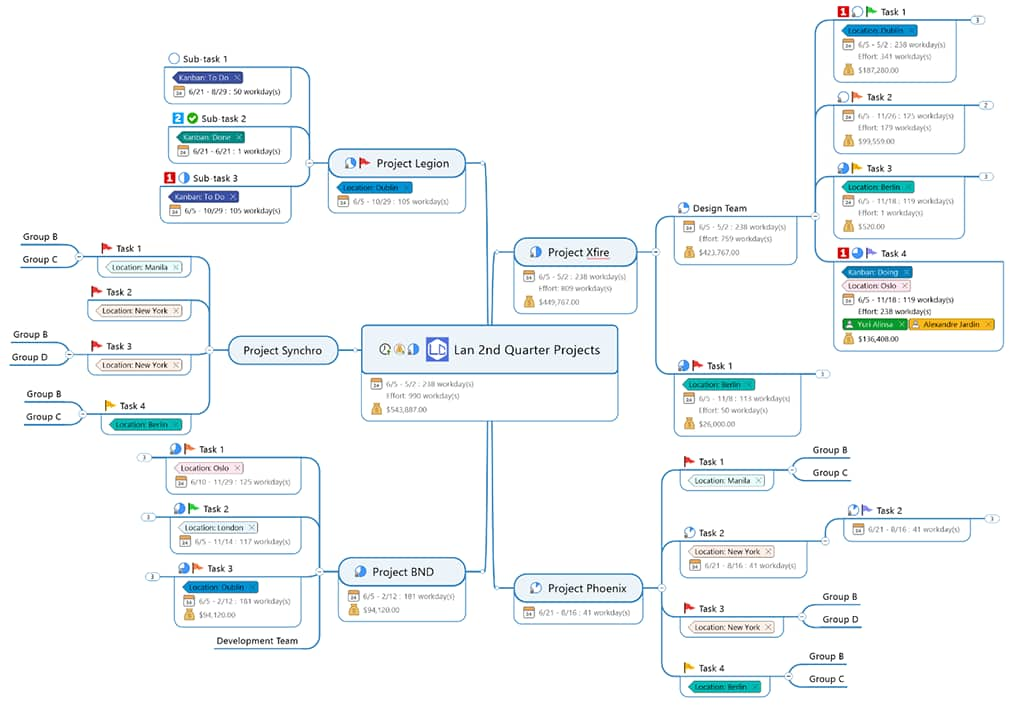
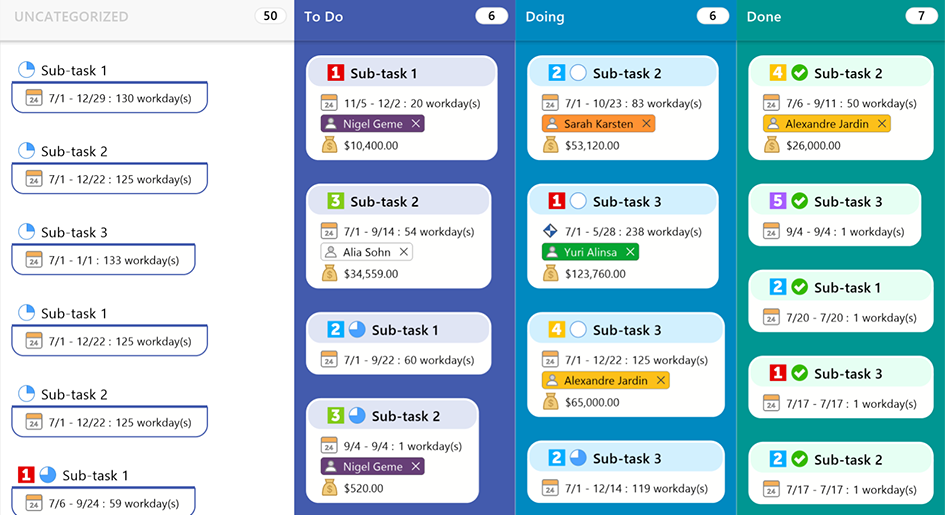
Once you’ve populated your map with your project details and various tasks related to each project, it will look something like this:
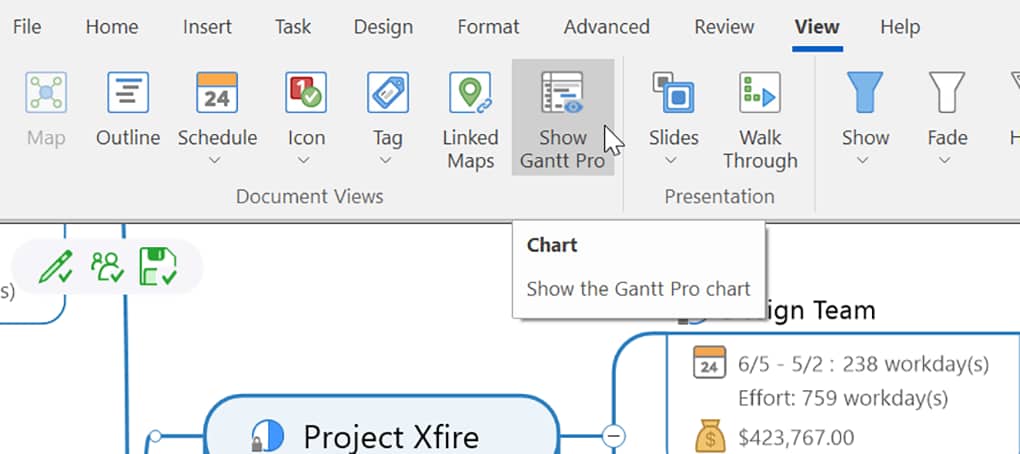
Now, you’re ready to see it in Gantt view, useful for visualizing your project and monitoring progress along a timeline. Click the “View” tab in the toolbar and select “Show Gantt Pro.”
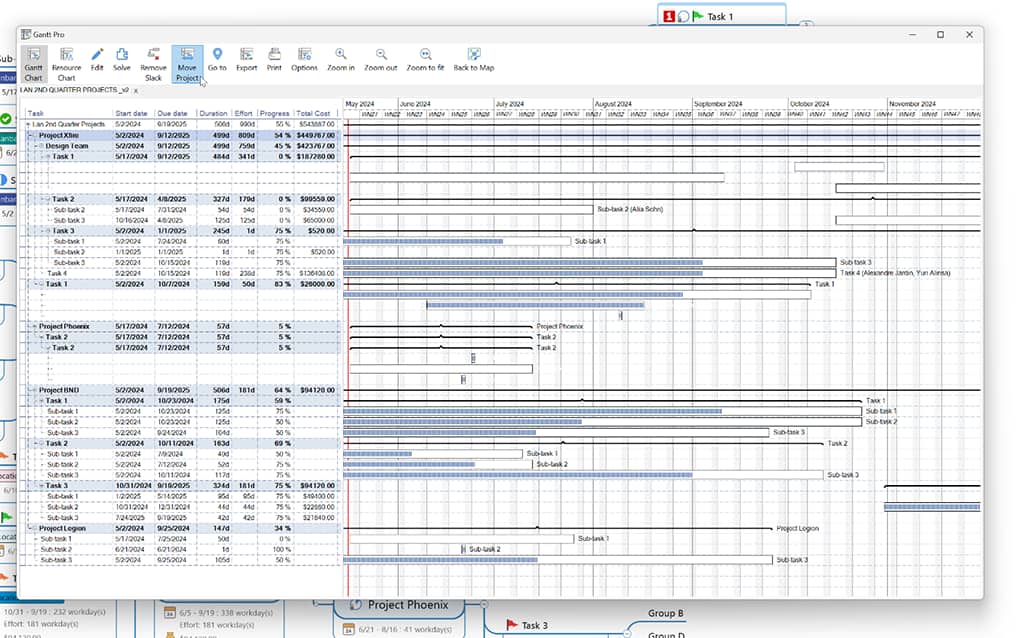
Selecting this option will bring up your Gantt chart. There are many useful options in the toolbar of the Gantt window, one of which is “Move Project,” which allows you to adjust the entire timeline of a project at once, including all tasks and sub-tasks.
Whether you're tracking a software development project or planning a physical product launch, MindManager makes it easy to create a Gantt chart that fits your needs.
Add different shapes, text, callouts, and due dates to visualize your project.
Set start and end dates, assign project tasks, insert documents, link to crucial information, or include sticky notes to mark valuable information.
MindManager brings the benefits of Gantt charts into the digital age. With an intuitive interface and easy-to-customize templates, digital Gantt charts empower your team to streamline workflows, track progress, and spot bottlenecks before they result in missed deadlines.
“Being able to turn a map into a Gantt chart and/or an outline depending on the situation and the audience really prevents a lot of unnecessary effort in reformatting all the time you have put into a map.”
See review“We conduct ongoing search efforts to identify candidate organizations to partner with on our annual blitz builds. We have been operating for over 20 years and have built more than 75 homes in total. As Site Selection Director, I use MindManager to keep track of potential partner organizations and progress through our evaluation and vetting processes. I am able to share the maps with my team, which contain links to files they can update regarding contacts, information gained, and status.”
See review“MindManager was used as part of our Product Management workflow to brainstorm product ideas mainly, but also later to project manage Go To Market launches, where we used the project planning and Gantt chart views extensively. The product was used throughout a team of 10 people, so the collaboration features through Sharepoint were also brought into play for working on documents within the team. With a distributed team across wide timezones, the product worked as an effective "whiteboarding" tool.”
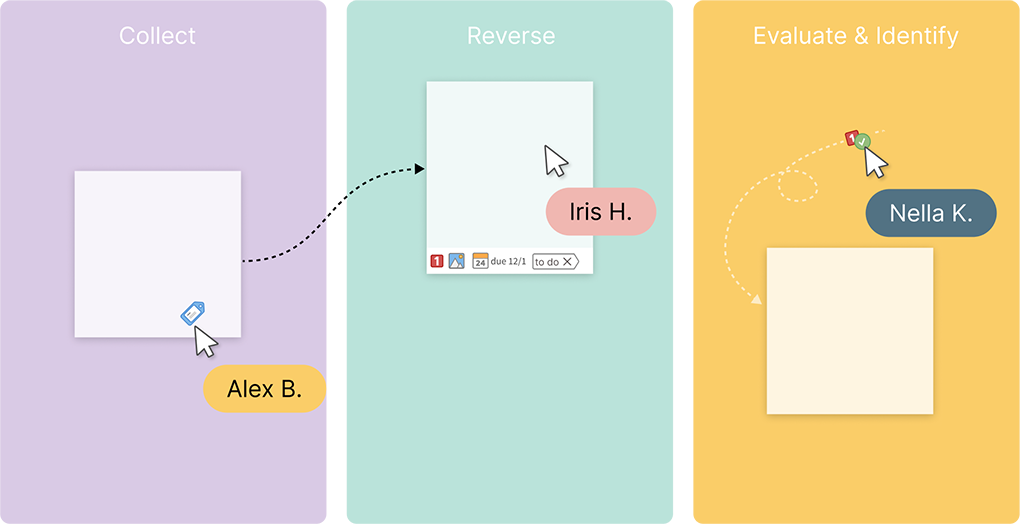
See reviewChoosing a suitable template is the first step in streamlining your project management. We recommend starting with a blank map to customize your Gantt chart. But MindManager has an array of various templates. Here’s a few to consider.
Kanban board templates make it easy to store and organize all the crucial data about a project in one place.
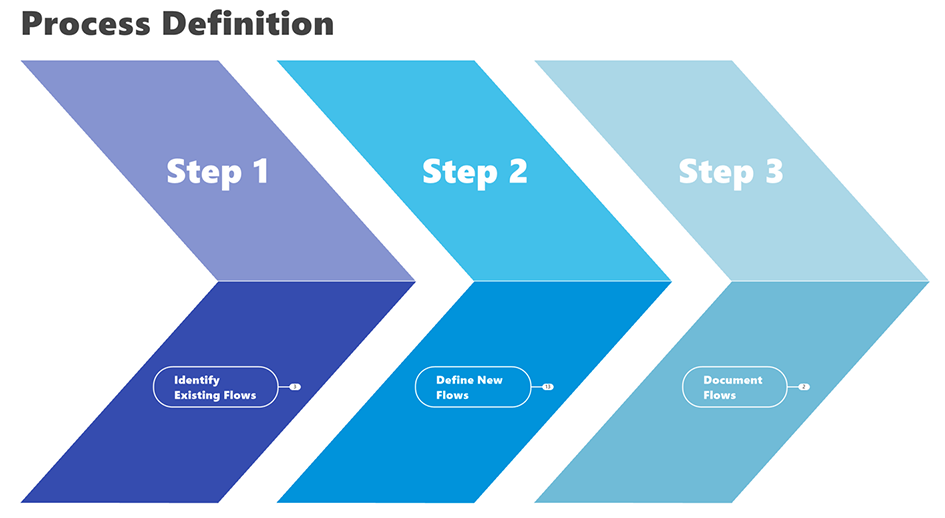
See Kanban board templateLike project plans, process maps outline the specific steps in your project using shapes and symbols to indicate flow, steps, subprocesses, and decisions.
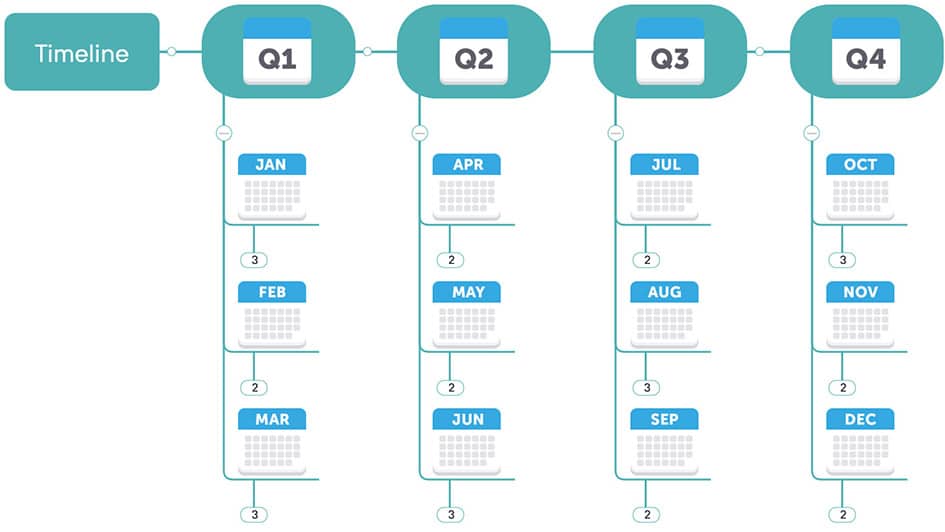
See process map templateVisualize and outline a project to view past and future milestones with our timeline chart template.
See timeline chart templateThe ARML-IdF team works with more than 68 missions to provide access to employment, healthcare, and legal services, so staying organized has been challenging. ARML-IdF uses MindManager to plan projects and hold more efficient meetings.
Gantt charts are a popular tool for managing projects, designing workflows, and helping teams work more efficiently.
Get answers to common Gannt chart questions below.
Current users can choose one of our Gantt chart templates from our template library or build their own. New members can sign up for a free trial and test Gantt charts.
Our platform makes it easy to create customized charts, add notes and PDFs, and even include your branding.
While there’s no free MindManager plan, there is a 30-day fully featured free trial.
Sign up for MindManager for 30 days to try out Gantt charts and all our other templates, including mind maps, flowcharts, and whiteboards.
While roadmaps and Gantt charts are project management tools, they serve different purposes. A roadmap is a high-level overview of a project that outlines a specific project's goal, direction, and deliverables.
It offers fewer details and covers a broader timeline. Roadmaps show stakeholders what to expect or help senior leadership determine whether to proceed with a project.
Gantt charts are incredibly detailed and cover specific deliverables, dependent tasks, who is responsible for them, and when they are due. The chart breaks down tasks into steps and covers resource allocation.
Gantt charts are used by team members and project managers who are executing the plan rather than providing a high-level overview for leadership.
Learn more about Gantt charts and how they can improve your project management process.
Gantt charts help teams confidently navigate complex projects, ensuring smooth collaboration, proactive risk management, and, ultimately, more successful projects. Everybody wins when your team spends less time planning projects and more time getting things done.