Try MindManager for free
For government, non-profit, and educational institutions.
Learn more
See more
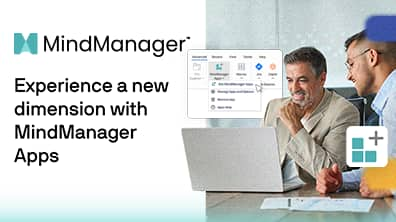
Create your own customized MindManager Apps and extend your desktop application with features that don’t exist yet.
Discover how to optimally use AI tools like Microsoft Copilot, OpenAI ChatGPT, Google Gemini, or Perplexity AI with MindManager.
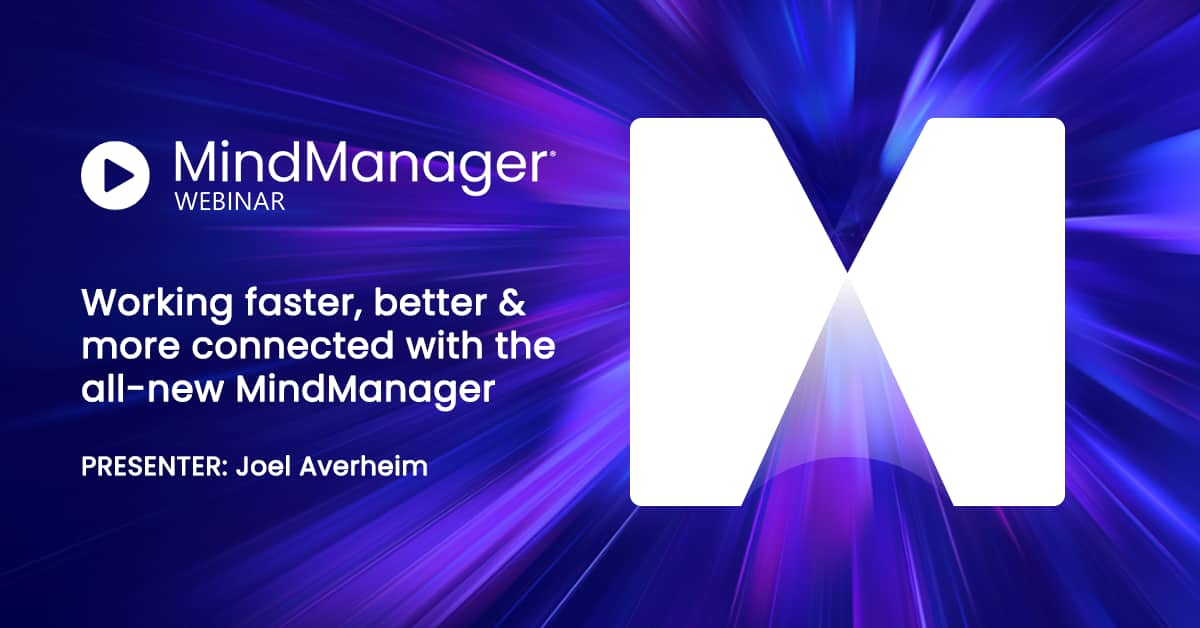
Join us for an insightful webinar where we unveil the latest enhancements in MindManager's latest release. Get ready to experience an array of exciting features designed to elevate your productivity and collaboration.
Learn the basics of MindManager in 5 on-demand tutorials
Join us for a dynamic LIVE discussion with MindManager experts. Ask questions, get answers, and increase your knowledge. Make the most of your MindManager capabilities!
Join us for a webinar exploring the synergy between the visual project mapping capabilities of MindManager® and the structured task management of Jira
Join us for an insightful webinar where we unveil the latest enhancements in MindManager's upcoming release. Get ready to experience an array of exciting features designed to elevate your productivity and collaboration.
Traditional brainstorming is flawed, hindering its impact. Join Michael Deutch, MindManager's Brand Ambassador, as he introduces and explores the concept of mindstorming: a powerful fusion of visualization tools and traditional ideation techniques. Learn about the concept, and how to run your own mindstorming sessions.
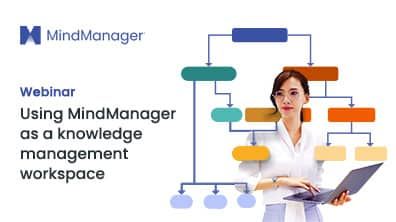
There is no better way to learn than by sharing your knowledge with others. In this webinar, you’ll learn how to use MindManager as a knowledge management workspace to share, communicate, and unlock the knowledge that you, your team, and organizational experts already possess.
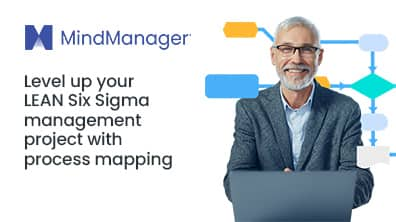
Meet process improvement consultant Jeff Kearns and join a conversation about LEAN Six Sigma management strategies, process mapping, and how to enhance project performance and efficiency.
Did you know that you can combine these business-critical communication capabilities with the strategic visualization capabilities of MindManager®!
In this webinar, we’ll introduce you to the world of MindManager for Microsoft Teams, the ultimate collaboration app.
In this session we’ll show you/you’ll learn:
Learn how to use MindManager as a visual planning tool to improve the process of documenting and organizing all key elements of any project.
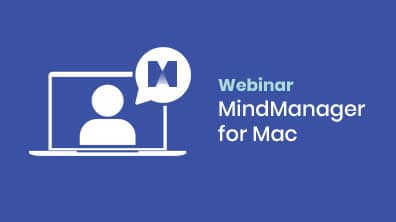
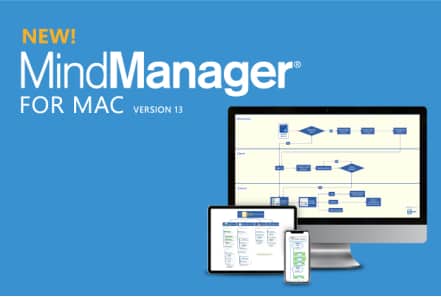
Join us for an exciting live session to learn all about the new MindManager® features available for the latest version of Mac!
Whether you’re a new user or a seasoned pro, you’ll discover innovative functionality designed to help you take control of project management, task tracking, and collaboration so you can get more done, faster.
Learn how to use interactive mind maps and other visual diagrams to align your product strategy and vision via a product roadmap.
Watch key sessions from our virtual customer event on demand! Discover proven strategies and practical insights from top thought leaders, visual planning and productivity experts, and MindManager customers.
Join us for a dynamic MindManager presentation featuring themes of synchronous and asynchronous collaboration, information capture and knowledge transfer. In addition, a student example will be shared by Barbara Van de Castle, DNP, RN-BC, APRN, OCN.
As teams stretch across spaces and time zones, speed, flexibility, and connectivity -- in our thinking AND in our tools -- are more essential to success than ever.
Explore the challenges of S1000D adoption and get tips on how individuals and organizations can overcome these obstacles.
Discover how to use mind mapping techniques and diagramming to execute competitive intelligence tasks.
71% of meeting attendees say that meetings are unproductive and inefficient. Team leaders just like you are taking a close look at their own meeting hygiene to see if there’s anything that they can freshen up.
Every day, 115 million people take advantage of Microsoft Teams instant chat messages, video conferencing, and meeting and calendar invites.
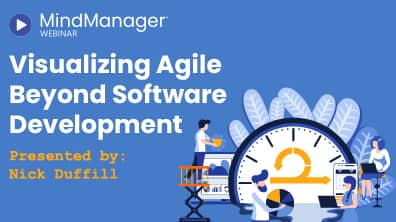
Agile and SCRUM were originally conceived as practical solutions for managing software projects, but the principles behind them can bring clarity across a wide range of business activities.
The challenge of project planning is to identify and understand not just the stated problem but its underlying cause.
Teachers and faculty in higher education have a lot to juggle on a good day.
This webinar introduces the functions and apps that are important and useful for working in a team.
Technical documents which support major, complex platforms are no longer a simple write and print process.
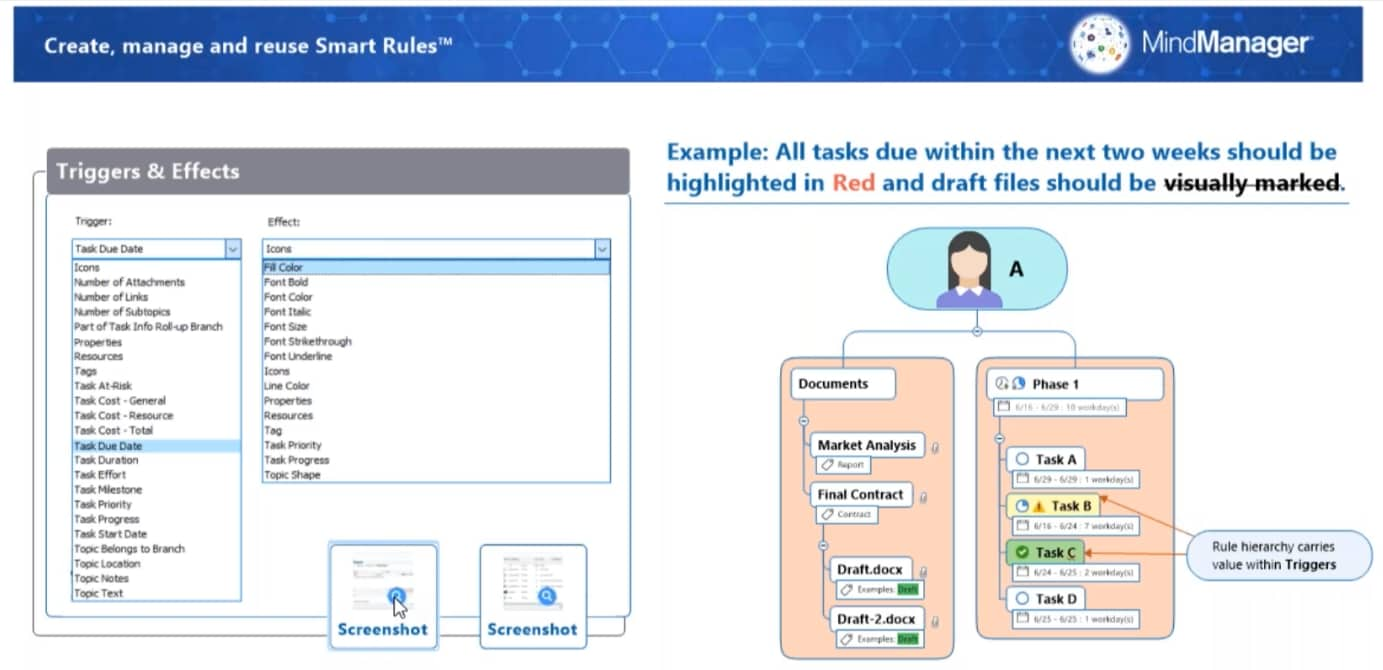
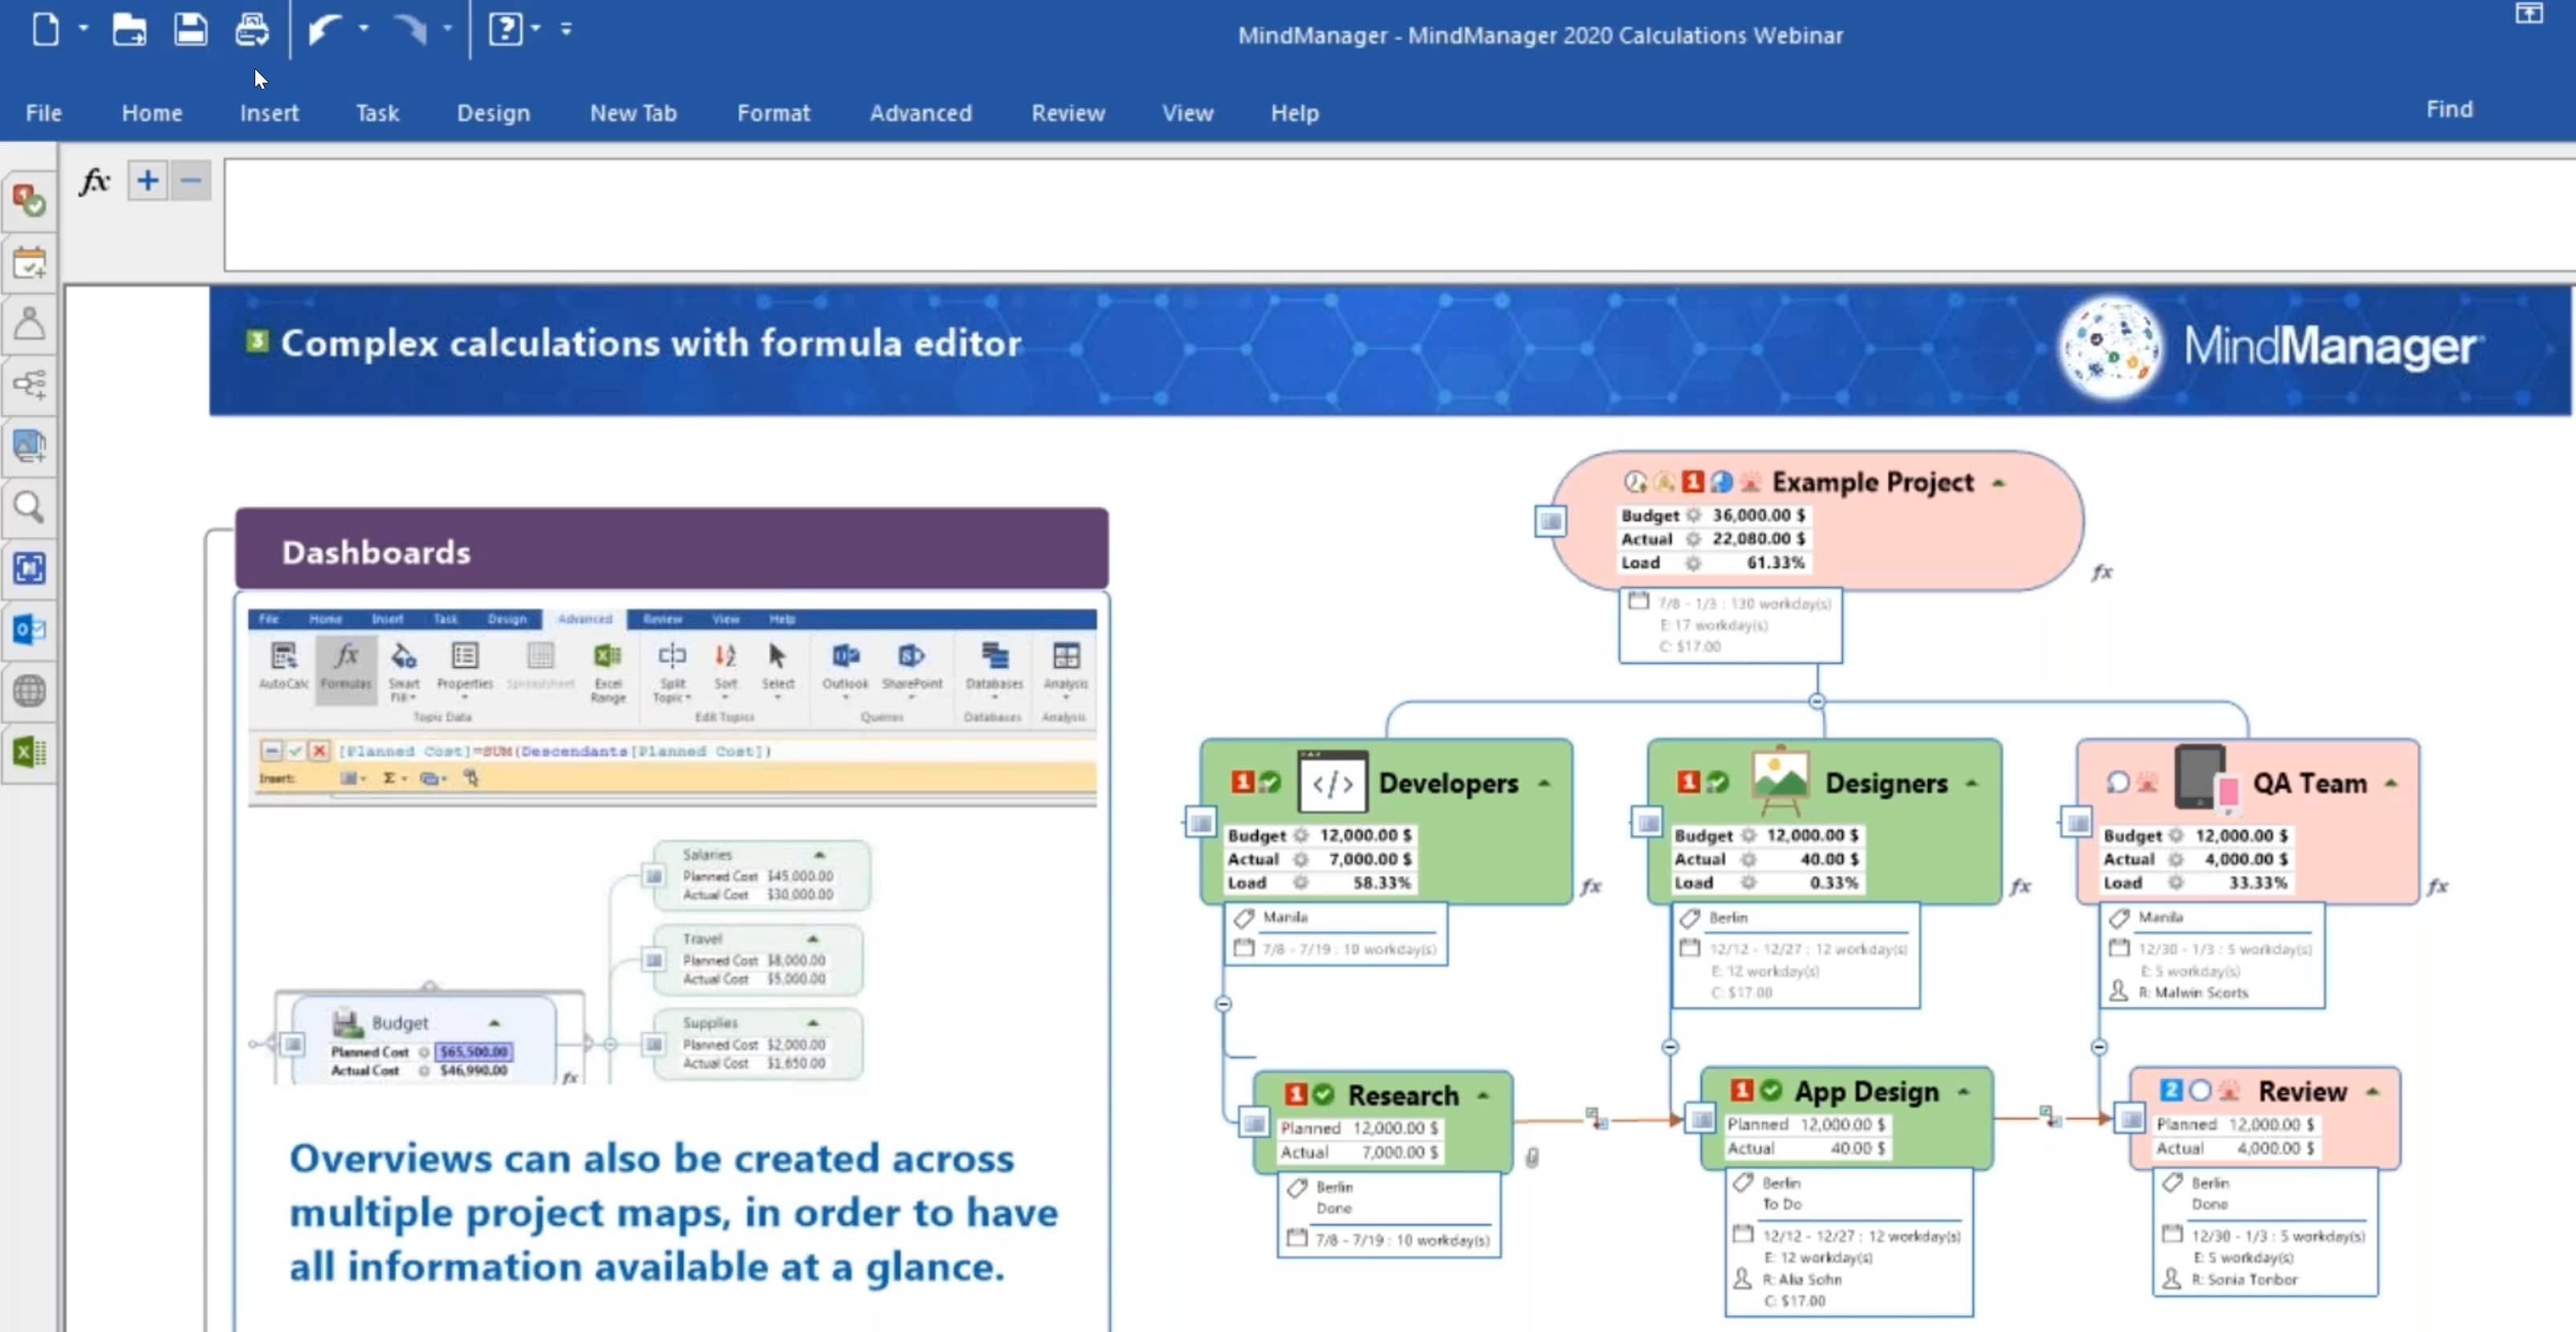
From the personal dashboard, information maps and flowcharts, to project maps: With MindManager Smart Rules ™ you can rule-based add elements and information to your maps and highlight important information.
MindManager for Mac 13 lets you connect everything that matters to your work, so you can think more clearly, make better decisions, and get to where you want to be.
Most of today’s Project Management tools force the user to jump right into defining tasks. The challenge then is to ensure that you don’t allow an inadequate tool to direct your planning process.
Changing technology, evolving business needs, economic pressures and global events like the Coronavirus can have devastating impacts on projects, especially if you’re blind-sided by them.
Key figures are well suited to quickly identify the most important facts from large amounts of data. With MindManager’s calculation capabilities, you can easily and flexibly calculate the metrics you need.
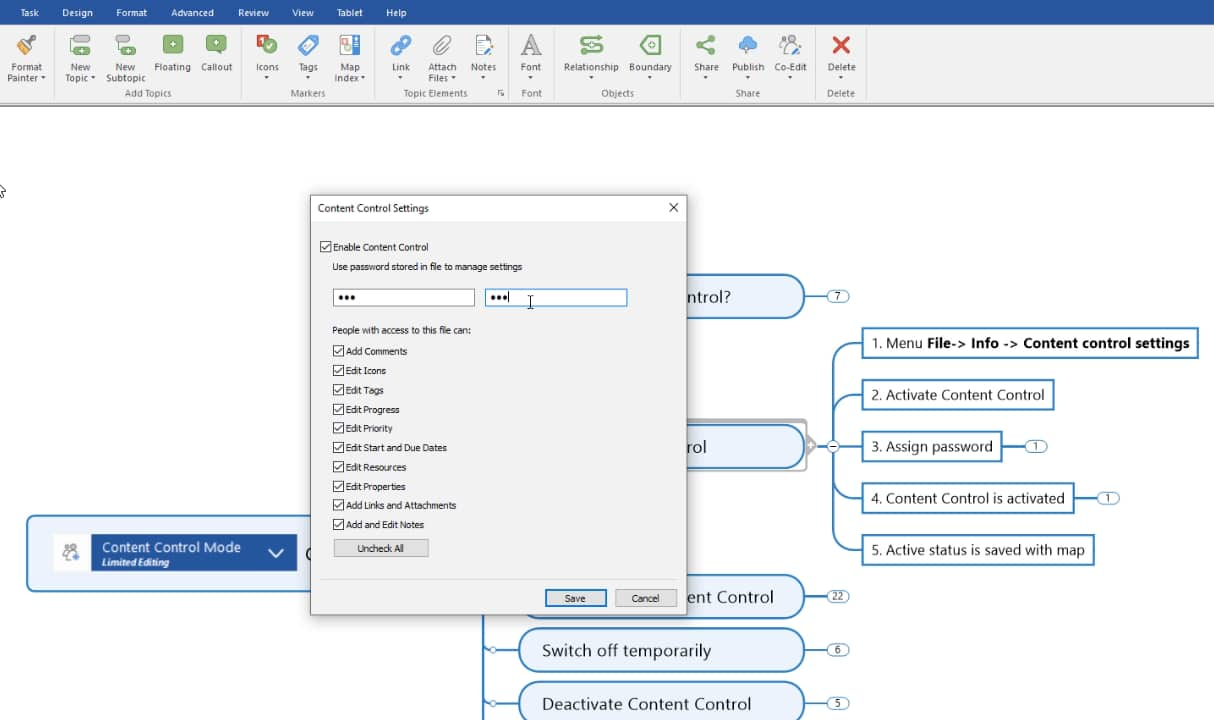
Successful project execution is a team effort. Content Control lets MindManager Enterprise clients share the responsibility of keeping project and planning maps updated, while maintaining control over what elements can be changed and who can change them.
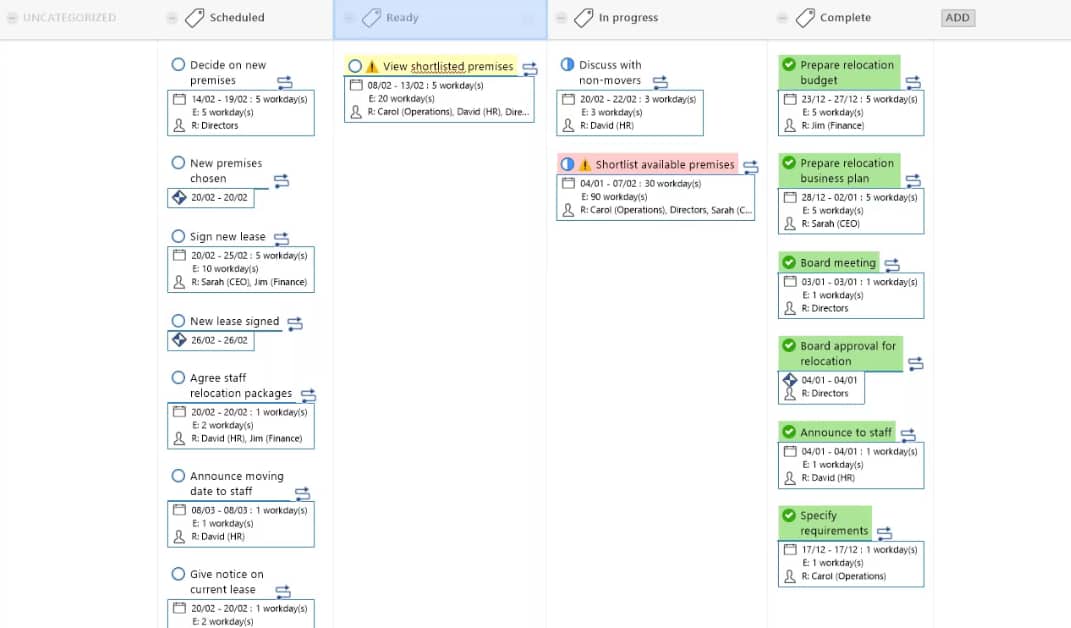
Visual dashboards are one of the most effective ways to manage information overload, and to ensure that mission-critical information and tasks don’t fall through the cracks.
We all know it happens. After a meeting takes place, there’s another “meeting”. Some people might avoid participating because they think it’s a big gripe session.
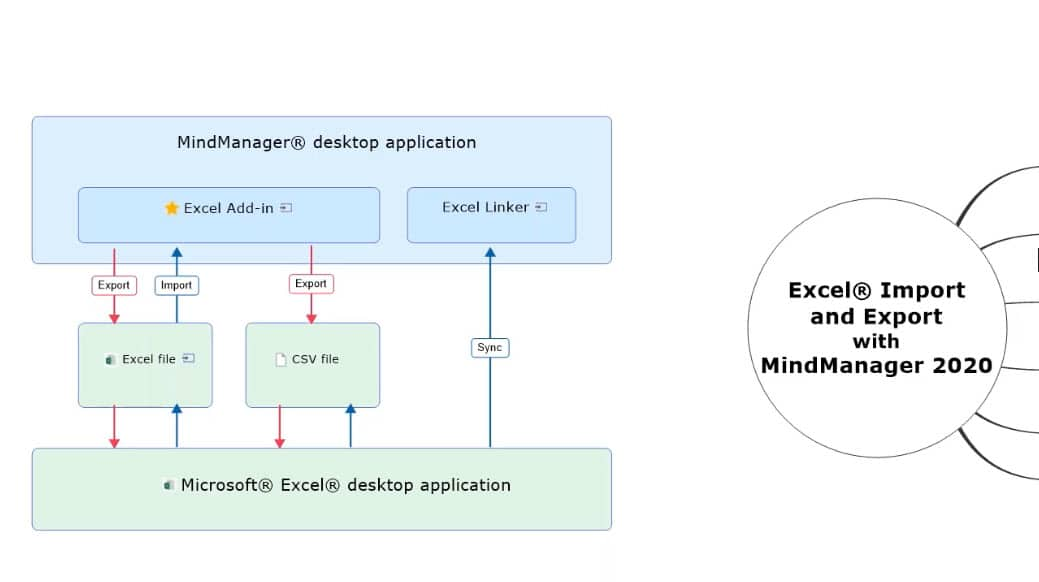
Microsoft Excel is a mission-critical application for knowledge workers worldwide. Our new features give you more control than ever before over the way you visualize, adapt, create and present Excel data within and from MindManager.
This webinar will be held in Spanish! Join our Spanish live webinar on the new version MindManager 2020 and discover all the exciting new features.
MindManager 2020 is packed with new features and product enhancements designed to help you achieve project management mastery.
There are no limits to the number of possible uses for MindManager. Business-relevant application areas range from project management and strategic planning to process mapping and much more.
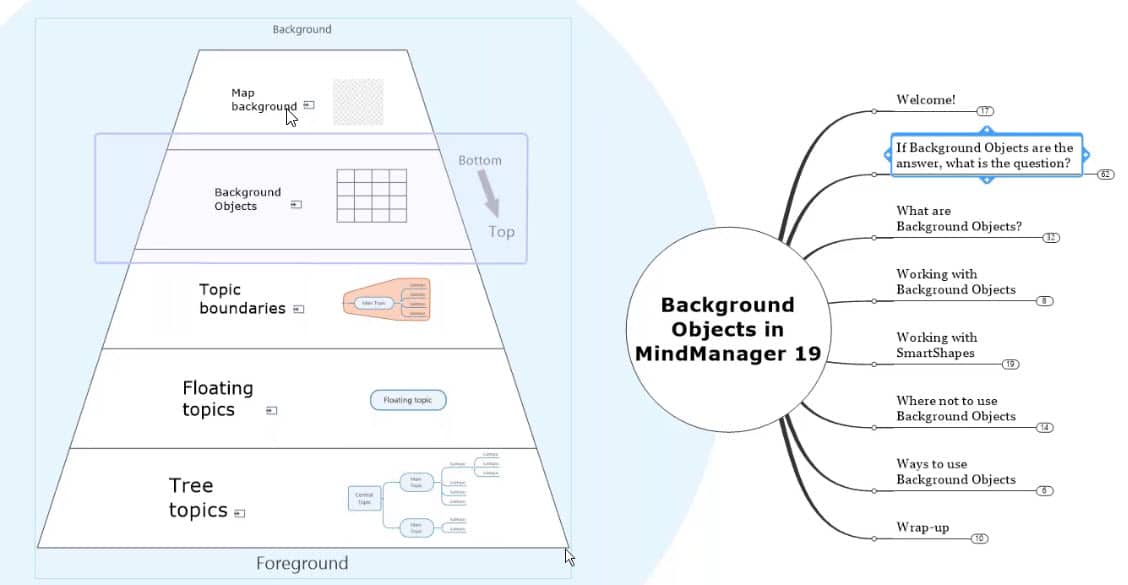
MindManager 2019 provides extensive design and working options thanks to background objects, including shapes, images, text fields and Smart Shapes.
In 1997, Jeff Kearns completed his first project using the Lean Six Sigma methodology. He hasn’t looked back.
Anyone who uses MindManager knows the advantages of visualization. Information of any kind can be structured and presented in a way that is easy for everyone to understand.
It would seem then that agile has gone mainstream. So if you thought it was only for young start-up companies, think again!
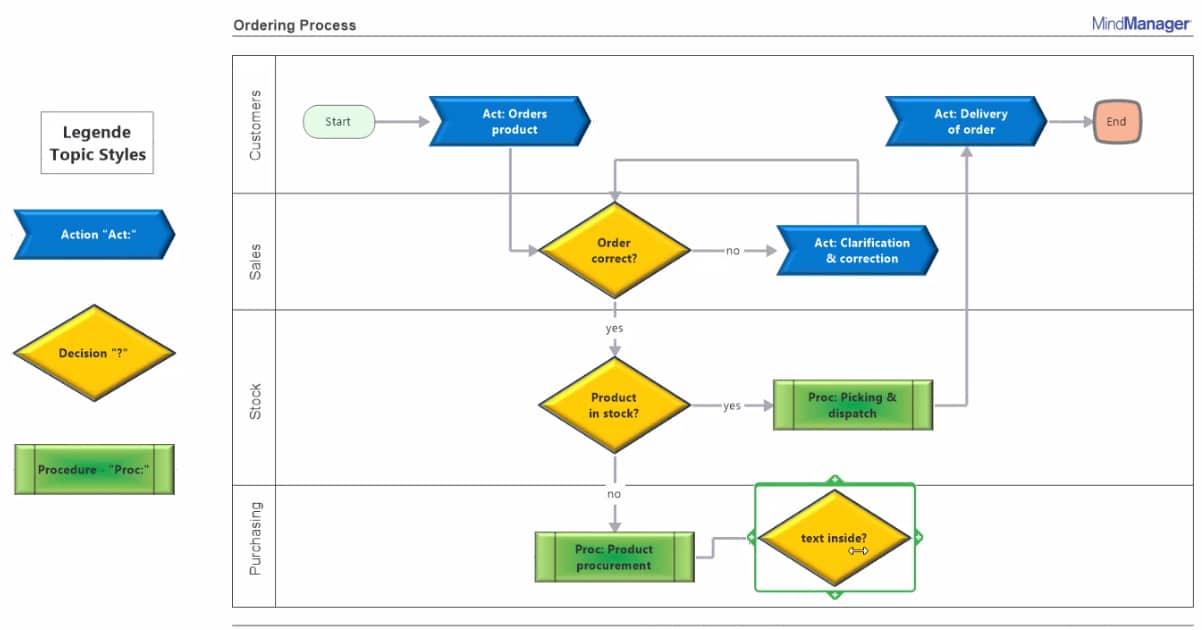
With the new version MindManager 2019 you have numerous new visualization possibilities at your disposal. This applies not only to the map format, but also to the flow charts and swimlane diagrams.
See your work and your work environment in a whole new light – find out what’s new in MindManager 12 for Mac in our live webinar!
Kanban is a simple but powerful visual planning and task management technique for projects and tasks that can revolutionize the way you work…
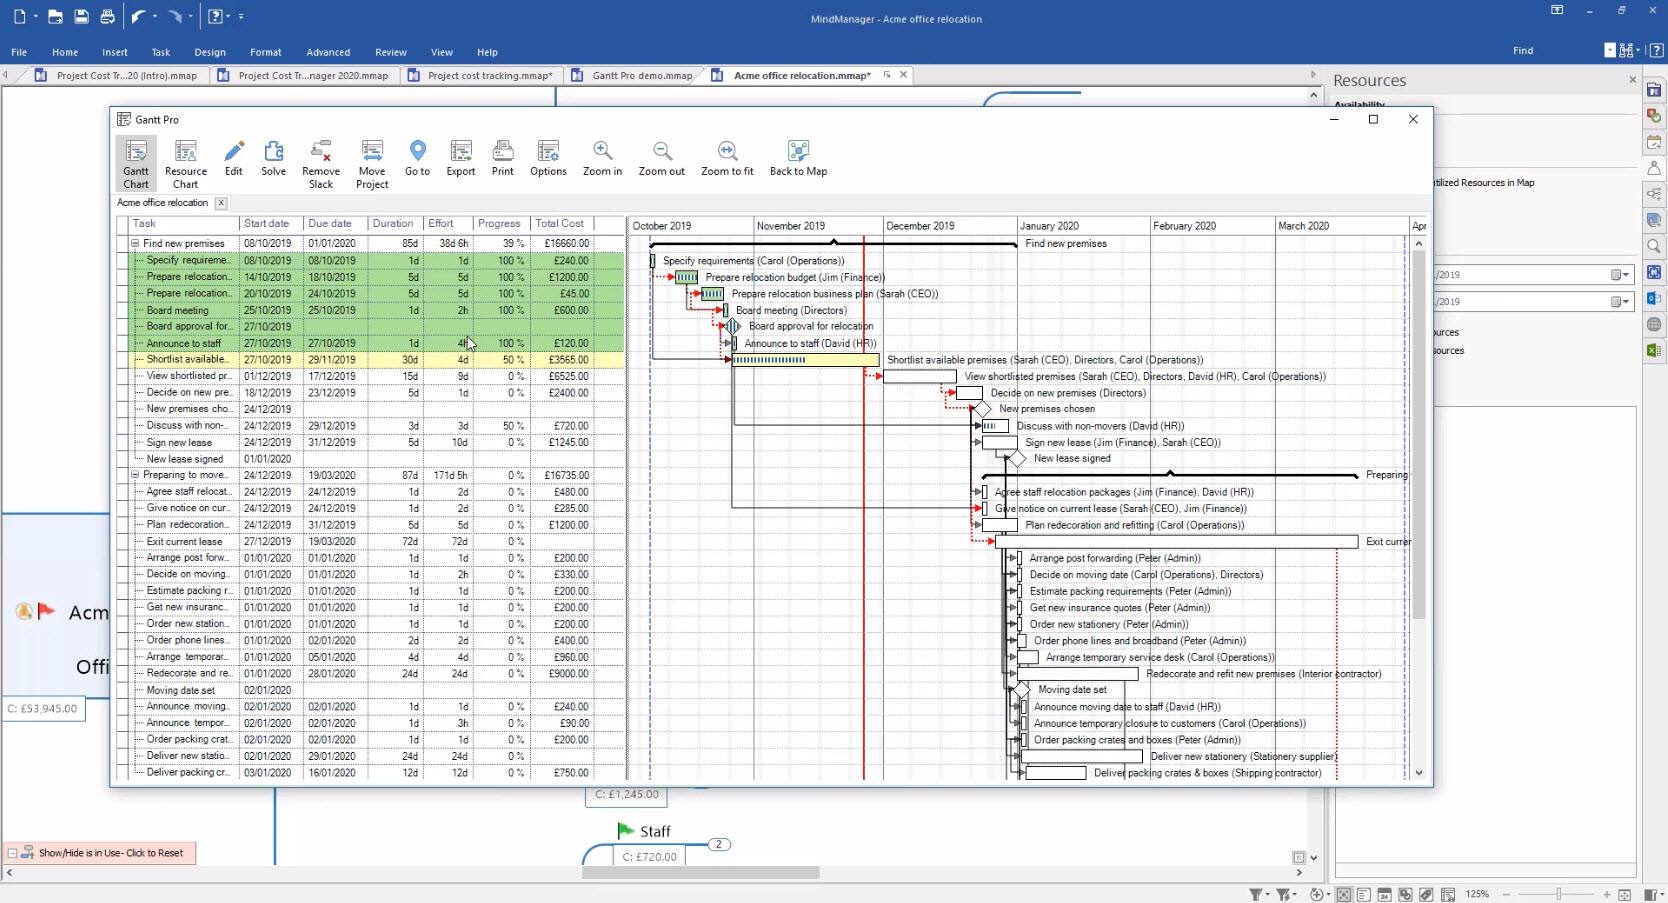
In addition to the well-known benefits of MindManager for project planning, the Gantt Pro feature in MindManager Enterprise provides project managers with a robust, detailed, and interactive Gantt diagram, detailing how project activities are tracking against time…
With the new MindManager 2019 for Windows, you have completely new possibilities on hand for presenting your information. In this webinar, our speaker Nick Duffill concentrates on the new and interactive views…
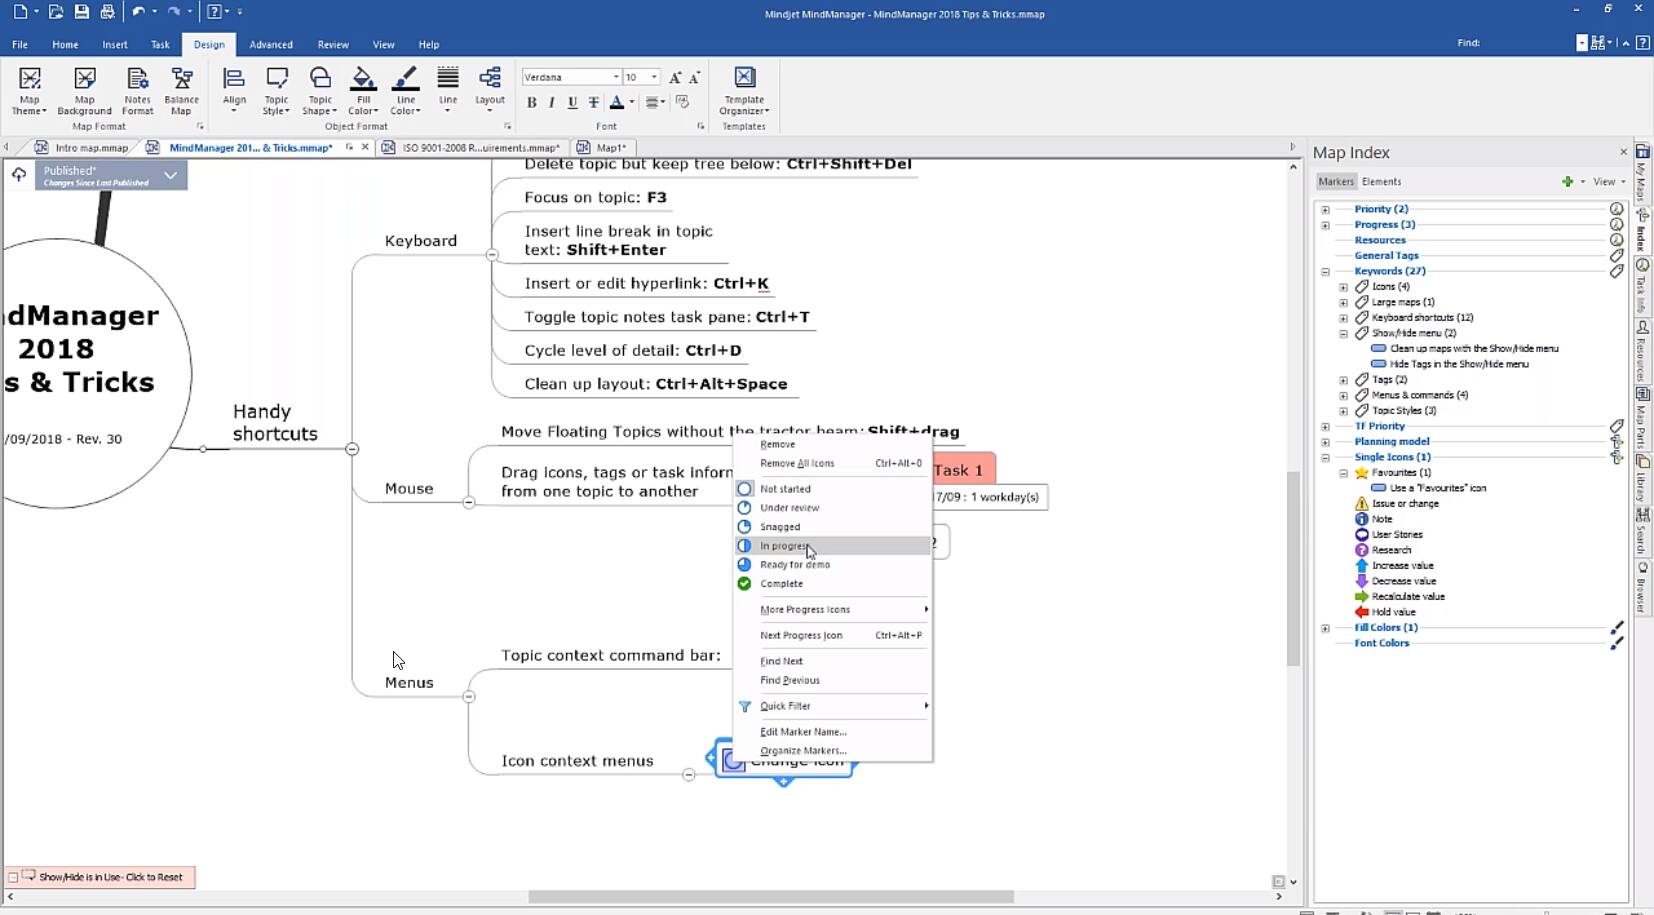
In our popular webinar series “Tips & Tricks”, we show you how you can make working with MindManager easier…
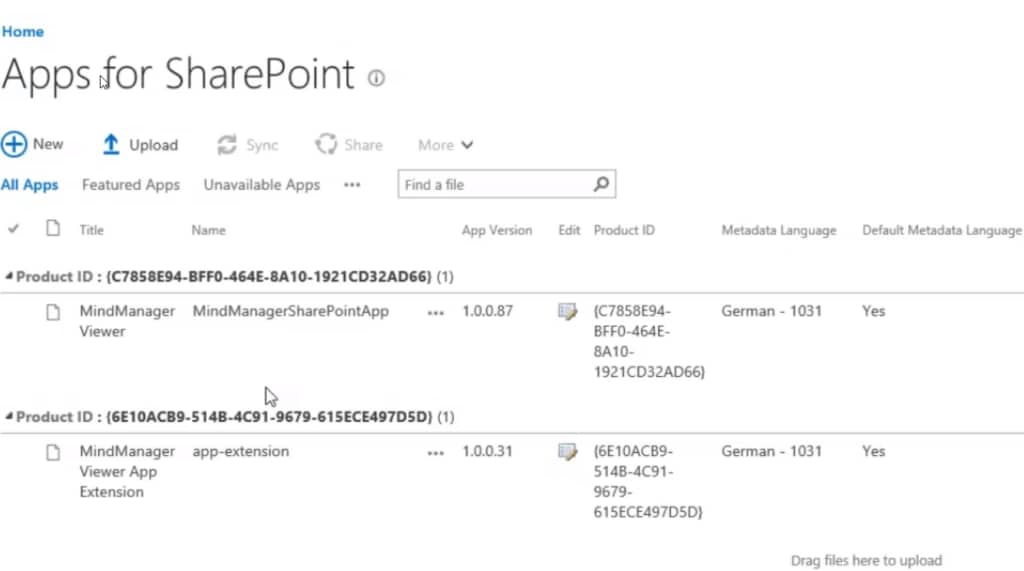
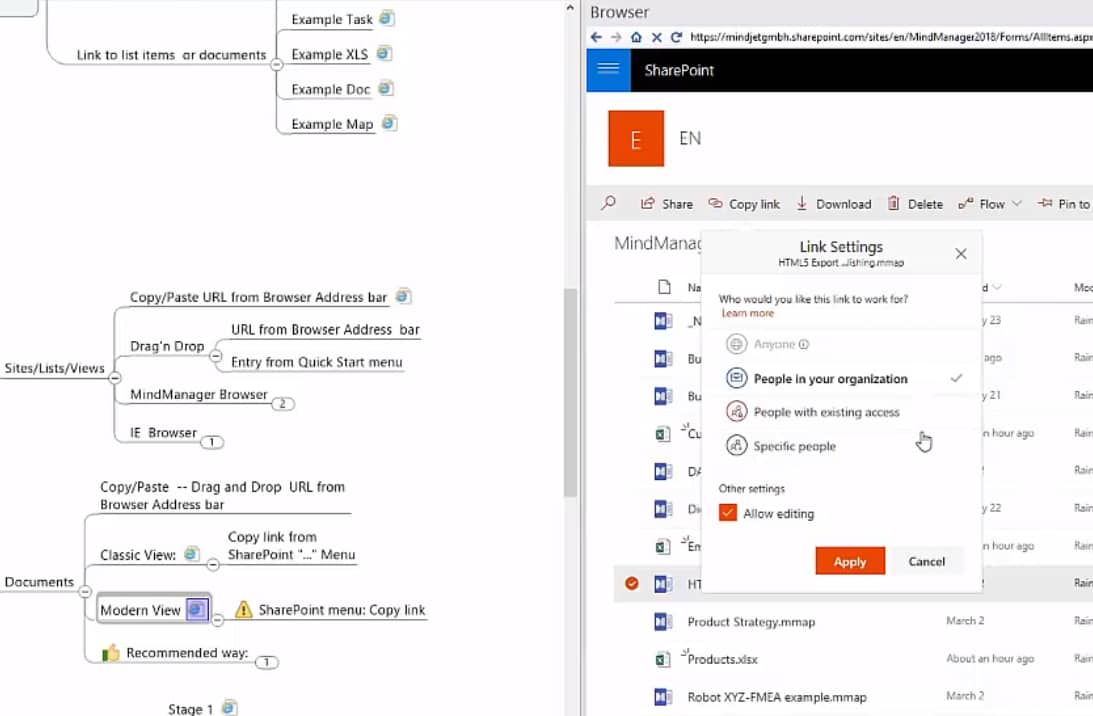
In addition to the SharePoint Linker for MindManager for Windows, the MindManager Enterprise license also includes the MindManager SharePoint Server App. With this SharePoint extension…
Sure, you’ve run countless meetings … and, hey, some were better than others.
With its Microsoft SharePoint integration, MindManager is making it easier to work not only with MindManager, but also with SharePoint. Users can easily save maps to SharePoint, reopen them and check…
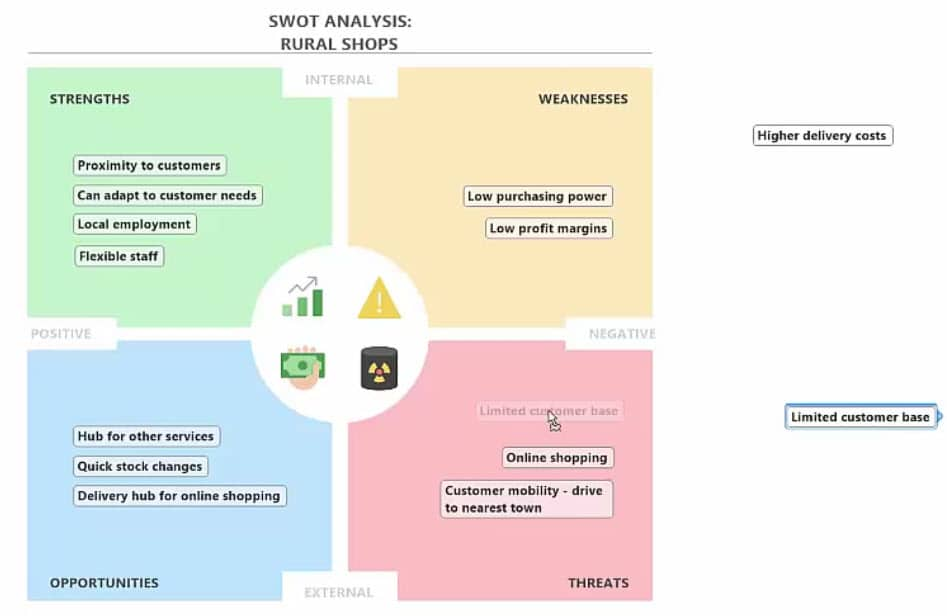
MindManager offers a variety of diagram types, starting with typical mind maps, concept maps and swim lanes, all the way up to Venn and onion diagrams, matrices and canvas boards…
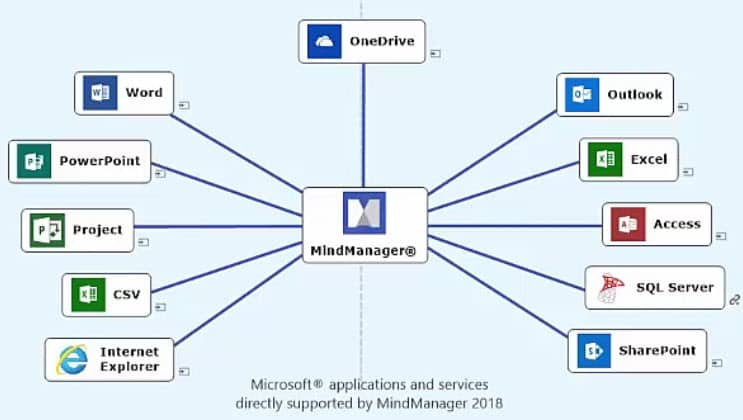
MindManager is characterized not only by its diverse application in many different departments and industries, but also by its integrations with other systems…
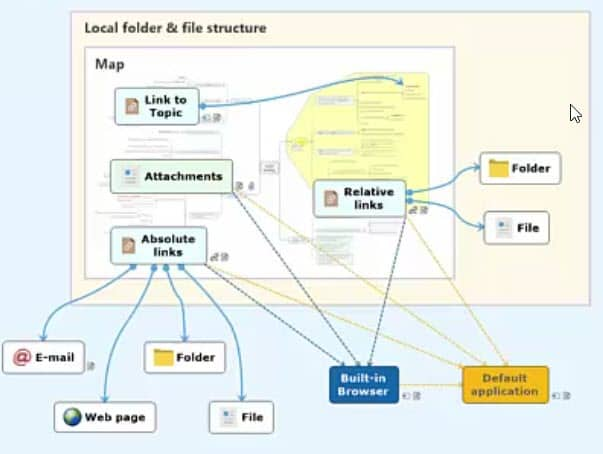
Working with hyperlinks and attachments can help simplify your work in MindManager. Relevant documents or websites are quickly accessible, eliminating the need for a long search through your files…
Imagine getting 3 extra hours’ worth of work done each day… without working any longer or harder than you do now.
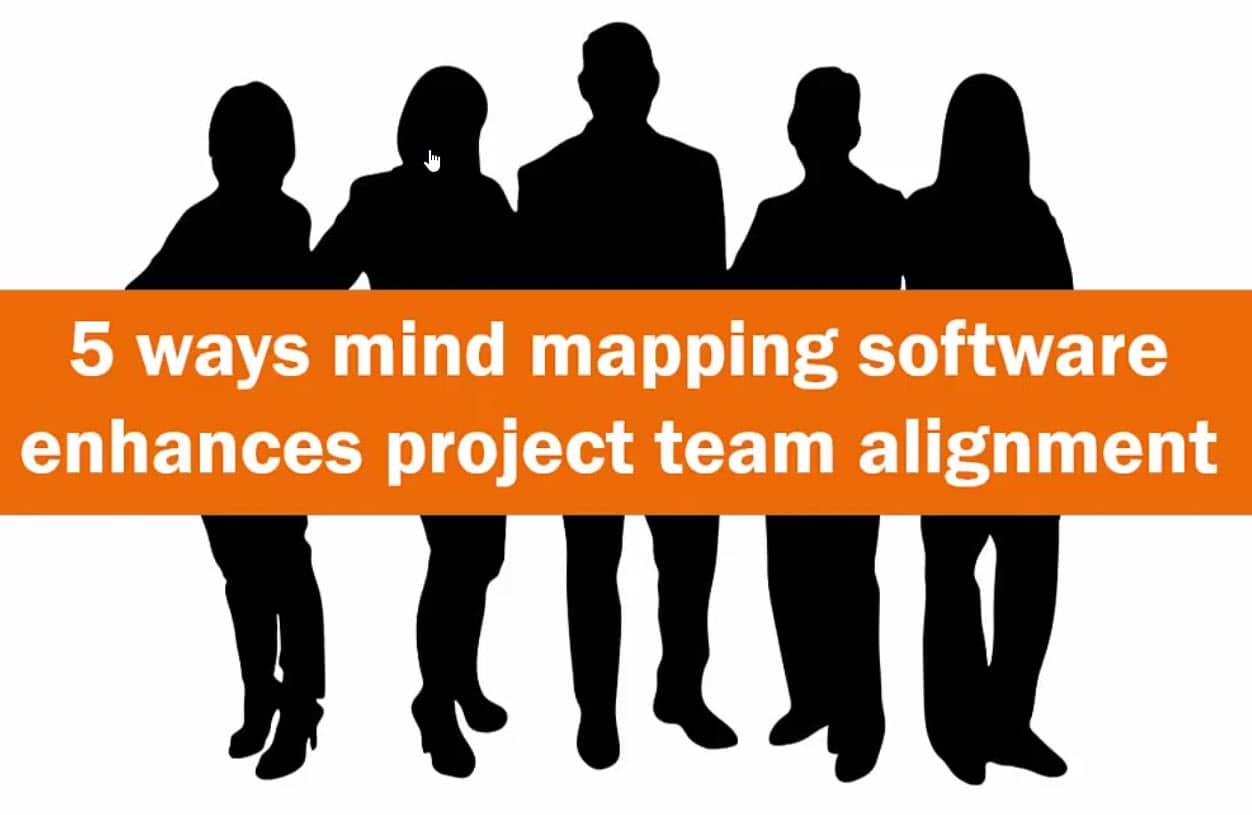
Getting–and keeping–everyone on the same page can often be more challenging and time-consuming than most project managers would care to admit.
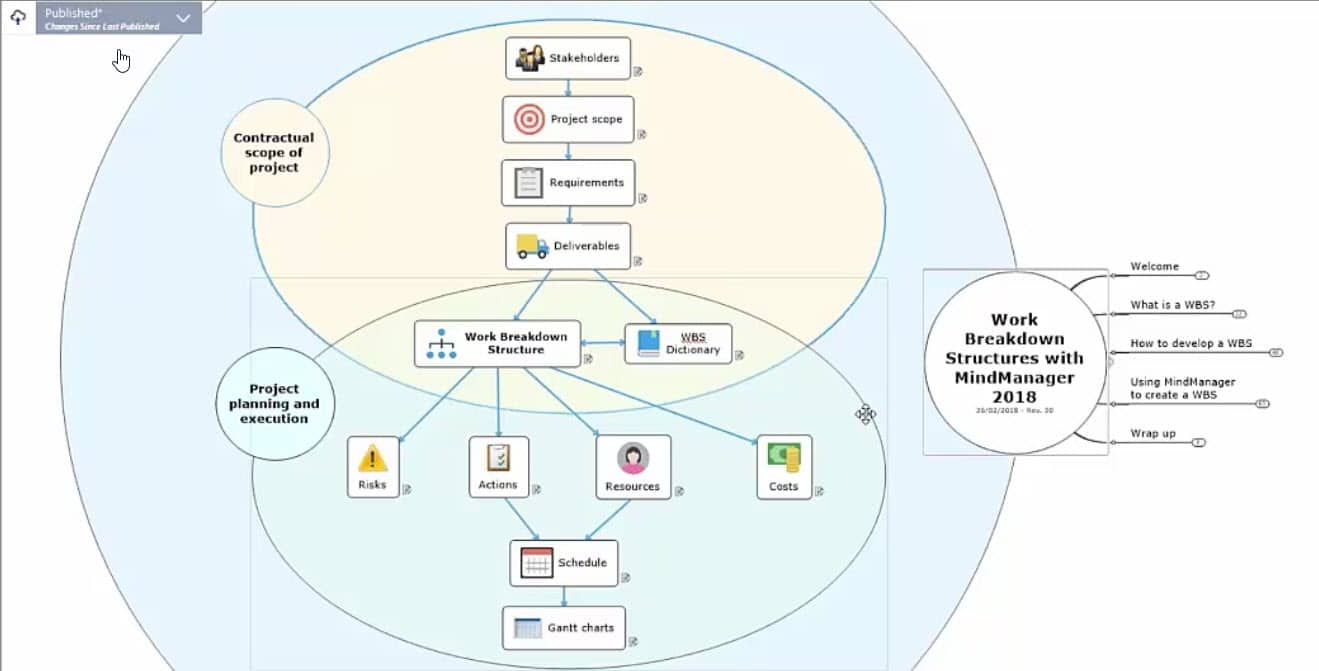
Our January webinar “Don’t Fear the Breakdown: Empowering Your Projects (and Sanity) with a WBS” enjoyed great popularity and received very positive feedback from all over the world.
PMBOK®, the generally accepted bible of project managers the world over, identifies the Work Breakdown Structure (WBS) as a critical stage in any project plan…
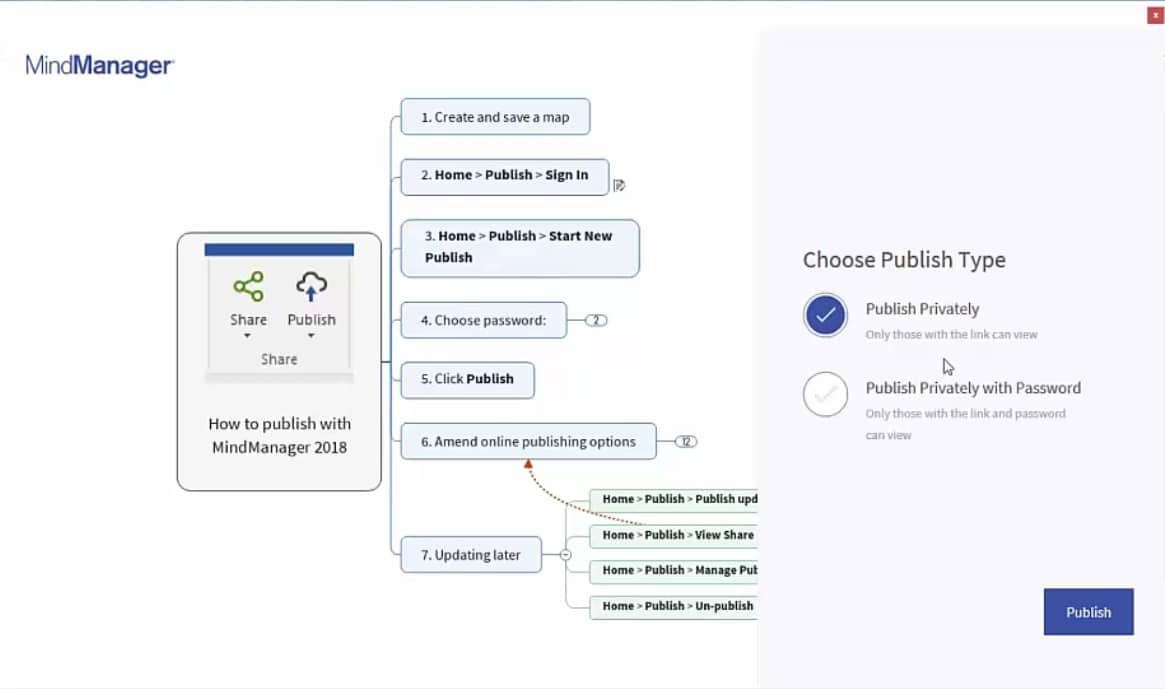
Join us for this 30-minute webinar and learn how to take advantage of one of the most exciting enhancements made available in the MindManager 2018 release: the Publisher feature…