An activity diagram is a type of Unified Modeling Language (UML) flowchart that shows the flow from one activity to another in a system or process. It's used to describe the different dynamic aspects of a system and is referred to as a 'behavior diagram' because it describes what should happen in the modeled system.
Even very complex systems can be visualized by activity diagrams. As a result, activity diagrams are often used in business process modeling or to describe the steps of a use case diagram within organizations. They show the individual steps in an activity and the order in which they are presented. They can also show the flow of data between activities.
Activity diagrams show the process from the start (the initial state) to the end (the final state). Each activity diagram includes an action, decision node, control flows, start node, and end node.
 |
Initial node | Represents the starting point of an activity. |
 |
Activity state | Represents the activities within the process. |
 |
Action | Represents the executable sub-areas of an activity. |
 |
Control flow | Represents the flow of control from one action to another. |
 |
Object flow | Represents the path of the objects moving through the activity. |
 |
Activity final node | Represents the end of all control flows within the activity. |
 |
Flow final node | Represents the end of a single control flow. |
 |
Decision node | Represents a conditional branch point with a single input and multiple outputs. |
|
Merge node | Represents the merging of flows with several inputs and only one output. |
 |
Fork | Represents a flow that can branch into two or more parallel flows. |
 |
Merge | Represents two inputs merging into a single output. |
 |
Signal sending | Represents sending a signal to an accepting activity. |
 |
Signal receipt | Represents that the activity has received the signal. |
 |
Comment | Can be used to add comments to elements. |
Activity diagrams are a great way to show the flow of activities in a system or process. They have a wide range of applications within organizations. Below are some potential use cases for activity diagrams:
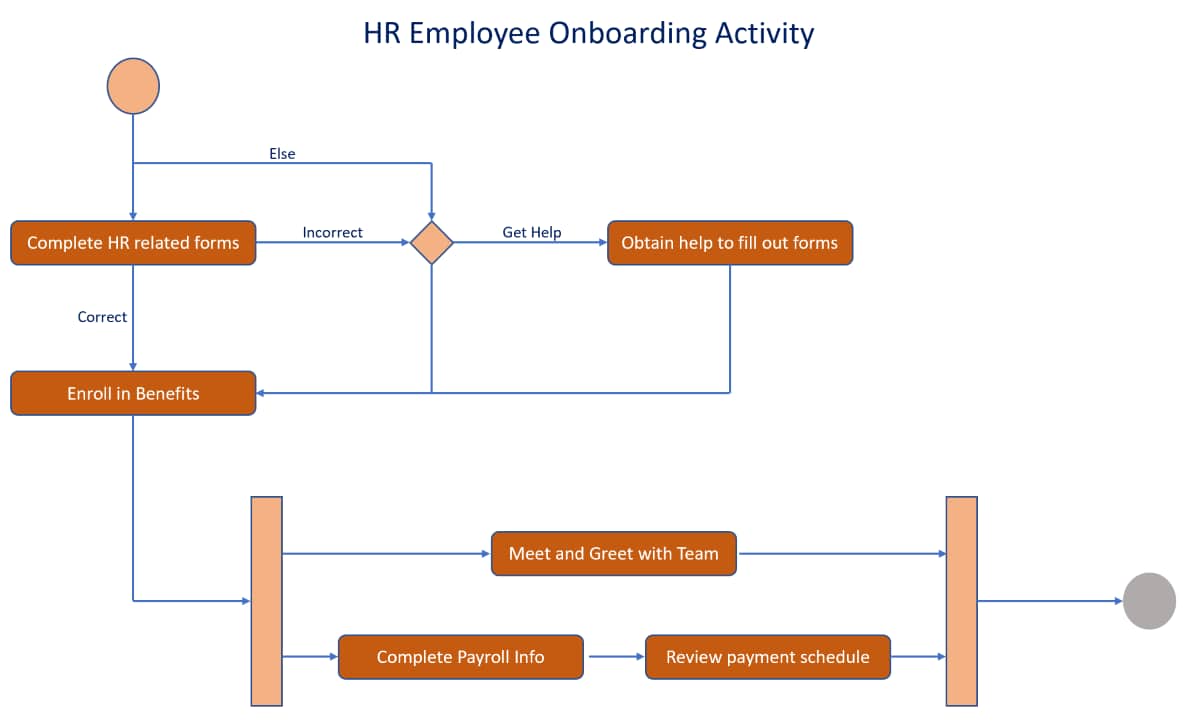
Activity diagrams are often used to show customer journeys. For instance, an activity diagram for a banking app can demonstrate the process of a user entering their credentials and logging in.
The chart will start with the user entering their username and password, which is an activity. The system will then check whether the username and password are correct, which is a decision. Two outcomes will flow from this decision: if the user has entered the correct username and password, the client will successfully log in. Otherwise, the diagram will loop back to the initial activity and prompt the user to re-enter their username and password.
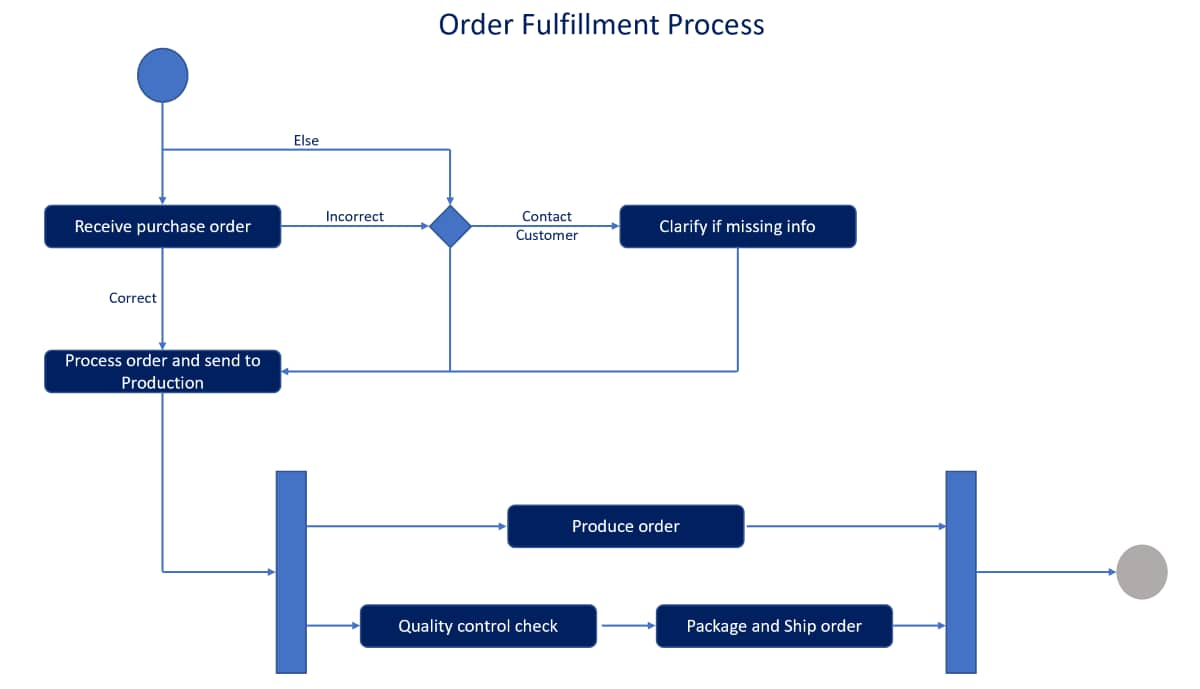
Businesses can use activity diagrams to show the process of receiving and shipping an order to the customer.
First, the system will notify the order, which is an activity. The order can then be accepted or rejected, which is a decision. If the order is rejected, it will immediately be closed. The order will be fulfilled if it's accepted, which is an activity node. Then, the diagram will progress to a fork node, determining whether to send an invoice or ship the order immediately. Once payment has been sent, the order can be shipped and closed, and the diagram reaches the final node.
A sales process activity diagram visualizes the steps in the sales process, which is a series of actions carried out by a sales team to find new clients, develop relationships, and close deals. Depending on the type of business, the specific steps in the sales process will vary. Visualizing this process increases transparency and can make it easier to find new leads, find qualified leads, and isolate bottlenecks and issues within the process. This improves efficiency and reduces waste.
For instance, your sales process is likely to differ significantly depending on factors like which sector the client belongs to, how much money the sales contract is worth, and whether the client is high-risk.
Here are some of the key benefits of using activity diagrams to show the flow of activities in a system or process within your organization:
Activity diagrams clearly show the progress of workflow between the users. This makes it easier for managers to see what's working well and where the bottlenecks are within the system to make relevant changes.
Activity diagrams provide a clear visualization of the logic of an algorithm. This provides a clear view of what's happening behind the scenes and makes it easy to identify what's working well and needs improvement.
A use case diagram is designed to show the different ways a user may interact with a system. An activity diagram vividly shows every single step taken within this use case diagram. This helps business managers to visualize business processes within the organization fully.
Activity diagrams can be used to model software architecture elements within a system by showing the relationships between the components and the constraints for assembling these components. This can provide a better understanding of how the system works.
Use cases can either be sequential or concurrent. Concurrent use cases can be tough to describe, as many different processes are happening simultaneously. Activity diagrams provide a clear visualization of these processes, making them easier to understand.
After familiarizing yourself with the common components of an activity diagram, your next step is understanding the elements you want to use. The activity itself is the main element of an activity diagram. However, it also constitutes other elements such as association, conditions, and constraints.
Once you have identified all the mentioned parameters, you must create a mental layout of how you want the activity diagram to flow. The final step is transforming the mental flow into an actual activity diagram by keying in the required details.
Here is a guide to help you to create your first activity diagram:
You can make activity diagrams by hand or in any graphic design program or use a program specifically designed for activity diagram making. MindManager, an industry-leading activity diagram software, allows you to create complex, detailed activity diagrams with ease.
MindManager's key benefits include:
MindManager helps you synthesize ideas and information by providing a simple, intuitive framework for organizing your thoughts. With MindManager, you and your team can clarify complexity and collaborate in new and unexpected ways.
MindManager comes pre-installed with many activity diagram templates. To use these templates:
Use case diagrams and activity diagrams are UML diagrams that describe changes within a system. The key difference between the two diagrams is that a use case diagram is designed to model the user interactions within the system. In contrast, an activity diagram is designed to model the system's workflow.
Activity diagrams are used in software engineering to understand the flow of programs at a high level. It can also help engineers to determine bottlenecks or constraints that are leading to particular events within a system.
There are 14 UML diagrams in total. These can be separated into two categories: structure diagrams, which show the things in the model system, and behavioral diagrams, which show what should happen in a system.
The structure diagrams are:
The behavioral diagrams are:
Activity diagrams show the flow of one activity to another within a system or process. Even complex systems can be visualized using activity diagrams.
They are used within organizations to model customer journeys, to show the process of receiving an order through shipping to the customer, and to model sales processes. They are also a good way to demonstrate the logic of an algorithm, show the steps taken when performing a UML use case, model the software architecture elements, and show the workflow progress amongst the users and the system.
Want to visualize your processes and remove the bottlenecks within your organization? Give MindManager a try today and start building activity diagrams with our easy-to-use templates.