If you were to join a Zoom meeting at work for a brainstorming session right now, chances are you’re working from a static document filled with bullet points of ideas.
What’s interesting, though, is rarely does everyone get a chance to share their ideas leading to a lack of engagement and innovation.
So where’s the disconnect?
Coming up with a solution to a problem isn’t always easy, especially with multiple people contributing. Turn your static document into real-time collaboration with web diagrams.
Web diagrams can bring your team together to easily map out topics and ideas to better understand the gaps and what to do next to help you make better decisions.
This guide will:
MindManager is one of the world's number one web diagram mapping tools for business. Sign up for MindManager for 30 days free!
A web diagram (see also mind map) is a visualization of how things are connected.
A web diagram begins with a central idea or a single idea, then branches off into related ideas. Other keywords or phrases can then be linked, creating the web pattern.
There are a variety of use cases for web diagrams, including but not limited to:
The advantage of using software to make a web diagram is that it allows you to remove or move ideas around quickly and creates a much tidier, cleaner result.
The MindManager team spoke with Thomas Schrüllkamp, Head of R&D Chassis Systems at Mubea Fahrwerksfedern GmbH, who works with a team of 60 to develop innovative products in the chassis segment. Thomas uses web diagrams for product innovation regularly.
Thomas shared, “We start with a blank map, in which, step by step, we develop the project and, ultimately the product. From brainstorming to scheduling to task distribution, we bring everything together in MindManager.”
A web diagram can improve collaboration and communication to help you make better business decisions.
Web diagrams can be used in various different visual layouts. Below are a few common examples of web diagrams.
Before UX designers create wireframes, information architecture is developed in partnership with SEO and Product Marketing teams.
Information architecture is the structure of the website. It helps website users flow quickly and conveniently throughout your website. Think about it like the main navigation and drop-downs you see.
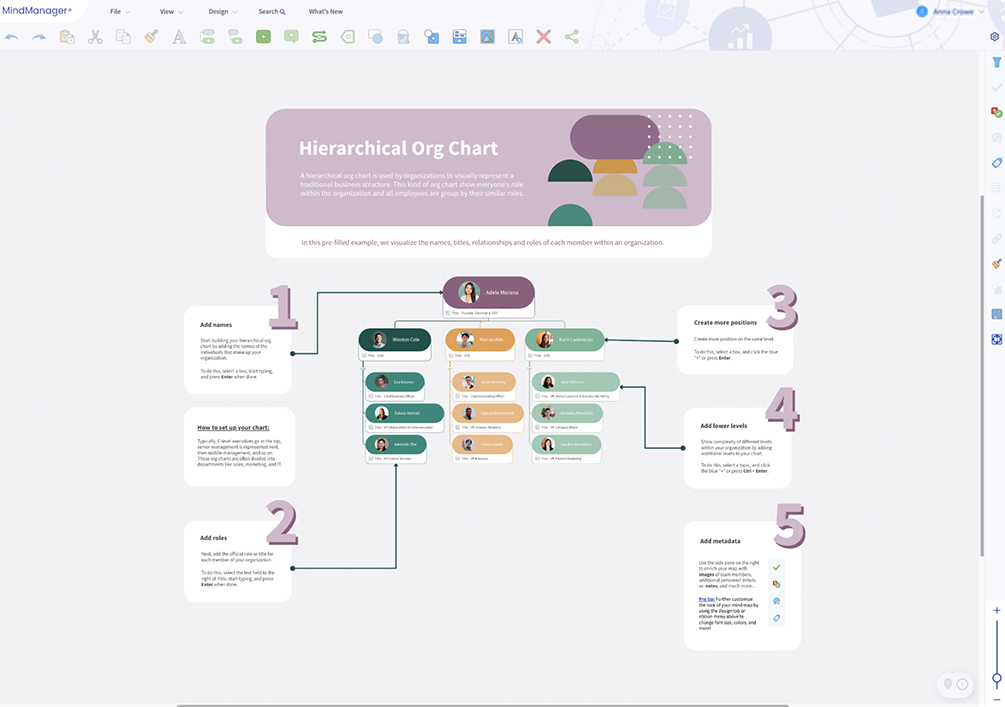
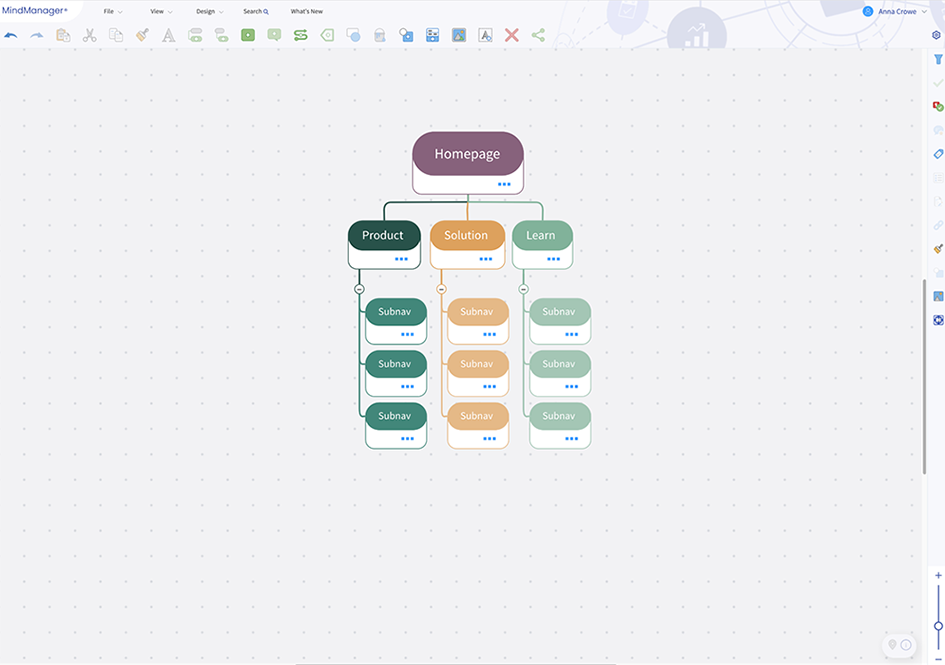
A web diagram can help you design and develop your site by starting with the homepage and creating the web of content from there.
Your main topic pages are the first points connecting to your homepage. From there, further content can be related to the main pages, which in turn relates back to the homepage.
If you’re looking to map out the structure of a website, use MindManager’s hierarchical org chart template after you sign in.
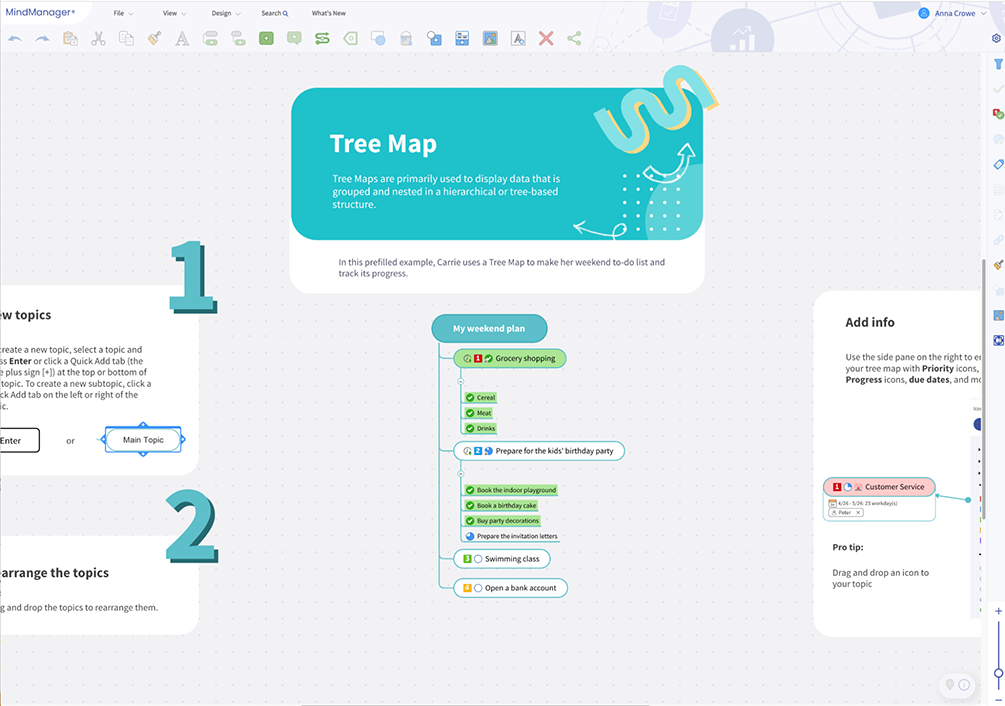
After the information architecture is created for a website, the UX designer will work with SEO and Product Marketing teams to create a sitemap.
A sitemap is a list of all the webpages on the website organized by the importance of hierarchy.
If you’re looking to build a sitemap for your website, use MindManager’s tree map template.
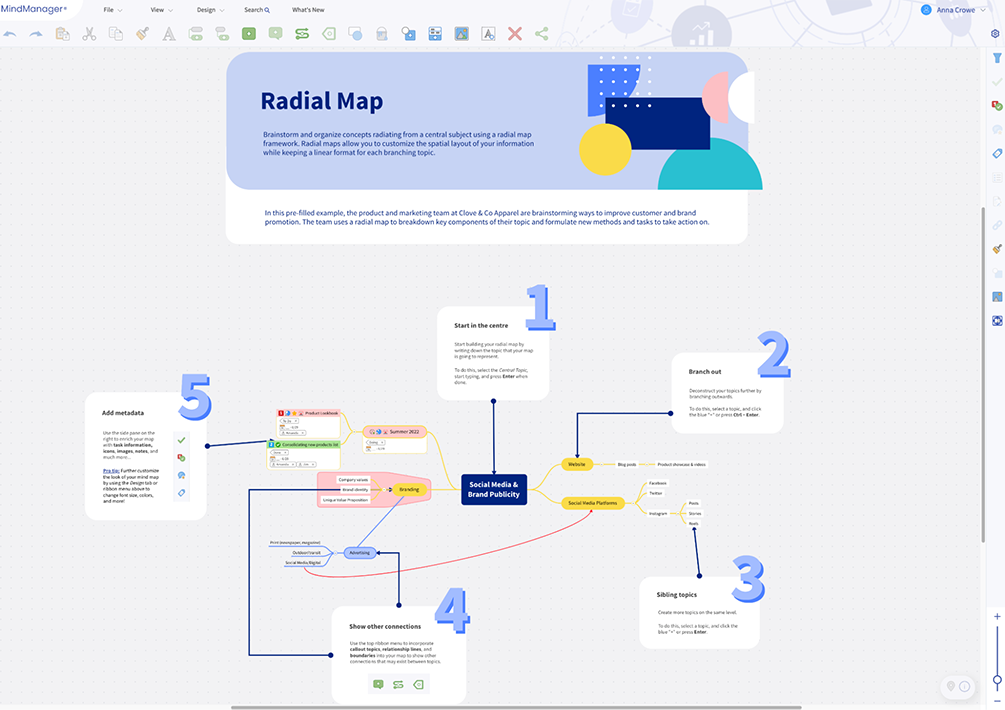
Spider diagrams (or radial maps) organize and display data in a logical, visual way. They help you connect ideas, explore possible solutions, and visualize ideas that may be difficult to understand.
If you’re looking to create a spider diagram, use MindManager’s radial map template after you sign in.
To make a web diagram using MindManager, follow the steps below.
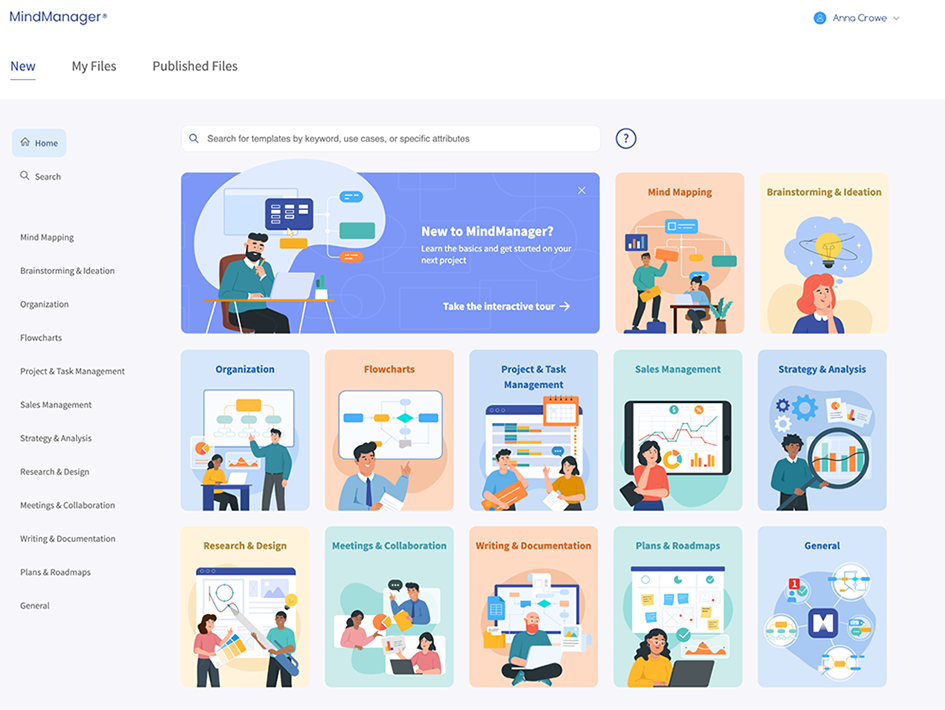
Sign in to your MindManager account.
Choose from one of the MindManager templates. For this example, we’ll choose the hierarchical org chart template.
Start with a single keyword, phrase, or image. In the example below, we started with the homepage.
Move from left to right. As web diagrams are often read in a logical order , it makes sense to start from the left and build it towards the right, like you are reading. In the example below, we started with Product on the left, moved to Solutions, and finally, Learn.
Connect lines to the next stages. Use lines and arrows to visualize how the next steps are connected to the first central idea. When creating a website, these are the pages that are directly accessible from the home page.
Continue the flow. Branch out from there to create a flowchart of how users navigate through a process. Some lines might loop back on themselves or connect to others, making it look like a literal web.
By the end of this process, you should have a clear visualization of how the items or steps in your diagram are connected and what logical order a user can follow through it.
MindManager is a web diagram mapping tool for project planning and management. It’s a streamlined software specifically for users to draw up their ideas in an easy, visual way.
MindManager is hailed as an industry-leading visual mapping software, as it helps you create many different visual maps to improve your planning and processes.
The maps on MindManager help you solve issues within your business and help you come to decisions to help you move forward.
The benefits of using MindManager over manual drawing for web diagrams include:
You can also download MindManager Snap, our Google Chrome extension, to save text, links, and images across the internet
Simply open up a new project, and within a few clicks begin mapping out your new idea to share with your team.
Web diagrams are where seeing becomes doing. Web diagrams help create a shared vision across teams, improve collaboration, and bring your plan to life.
As web diagrams become ingrained into your company culture, teammates will be ready to dive right in at your next brainstorming meeting – establishing trust and alignment.
If you’re in the early stages of figuring out how a project will develop and want to use a simple, visual web mapping tool, sign up for MindManager for free today!
Creating web diagrams in MindManager is easy and intuitive. Simply choose a pre-made template and follow our steps for making a flowchart. To get started making your own web diagrams, try MindManager free for 30 days.