A fishbone diagram is a visualization tool used in business to identify and investigate the many possible causes of a particular event, issue, or outcome. Fishbone diagrams are also known as cause and effect diagrams or Ishikawa diagrams, the latter named for the diagram's original creator, Japanese organizational theorist Kaoru Ishikawa.
Fishbone diagrams are a valuable tool for root cause analysis (RCA), as they provide a systematic framework for exploring all possible causes of a problem, not just the most obvious ones.
As the name implies, fishbone diagrams are shaped like fish—or, rather, fish skeletons. The parts of the fish represent certain parts of the cause-and-effect scenario you're exploring.
There are a few main types of fishbone diagrams, each with unique features and ideal use cases. Review the different types, and choose which one is the best fit for your needs.
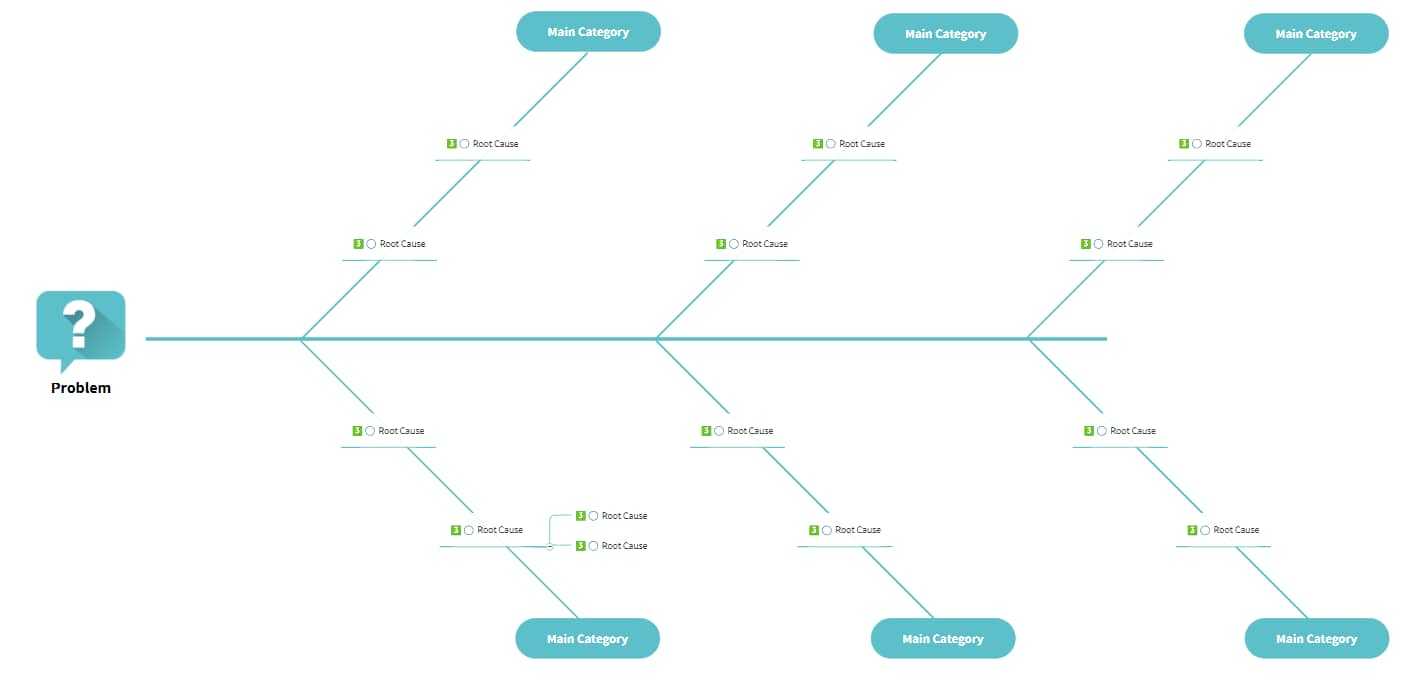
The most commonly used fishbone diagram is the simple fishbone. This type of diagram does not have predefined categories, so you are free to use whatever categories or labels make the most sense for your scenario. Simple fishbone diagrams can be used in any industry or function.
On a 4S fishbone diagram, the four "bones" branching off from the spine are systems, surroundings, skills, and suppliers. The 4S fishbone is popular in the service industry and can be used to solve problems like poor customer feedback or high customer churn.
The 8P method is a problem-solving method that classifies possible causes of a problem into eight groups: physical evidence, personnel, place, product (service), price, promotion, process, and productivity/quality. The 8P fishbone is commonly used to solve problems within the service industry, manufacturing, and administrative functions.
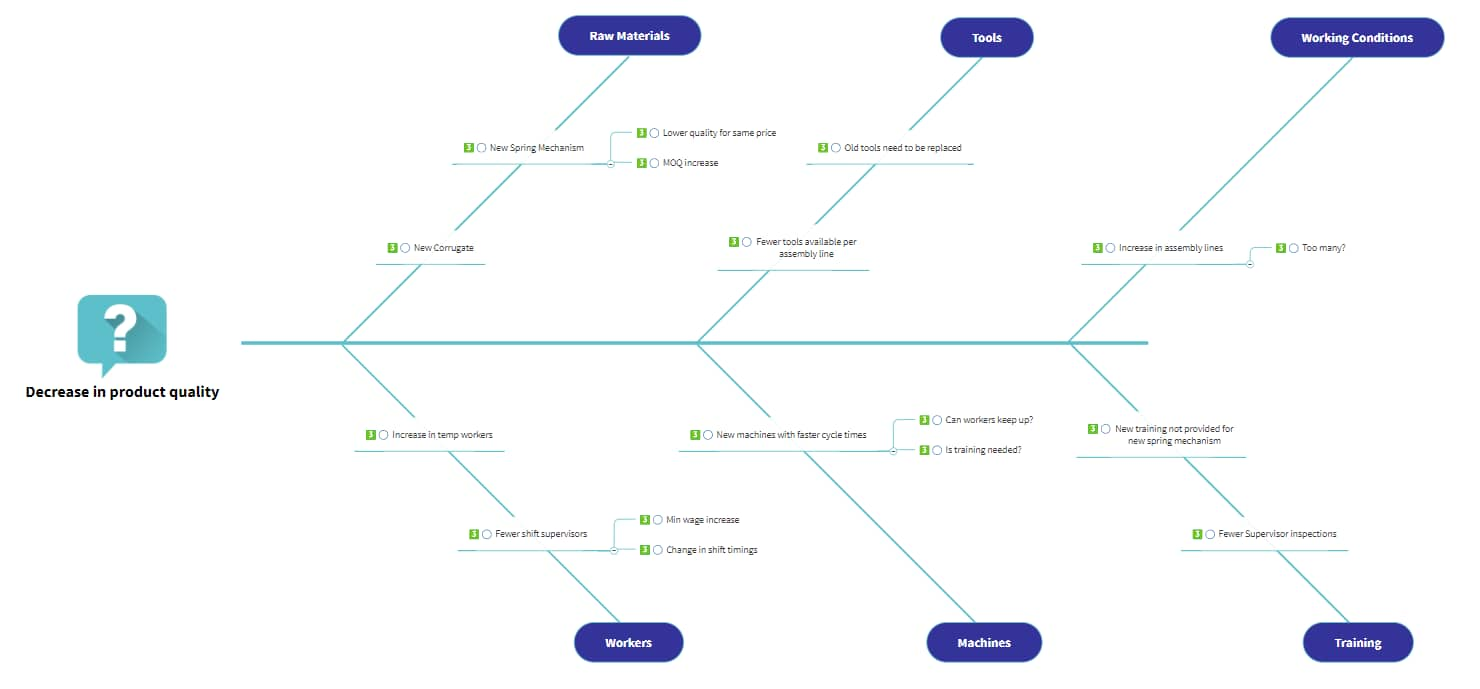
The man machines materials fishbone is another fishbone diagram with predefined categories. This type of diagram is mostly used in manufacturing. It was developed to help people focus on various causes rather than automatically blaming an issue on human error.
Fishbone diagrams are a useful tool for problem-solving, especially for tricky problems and ones that could stem from various causes.
If you're still wondering when to use a fishbone diagram to support your problem-solving activities, read these fishbone diagram examples.
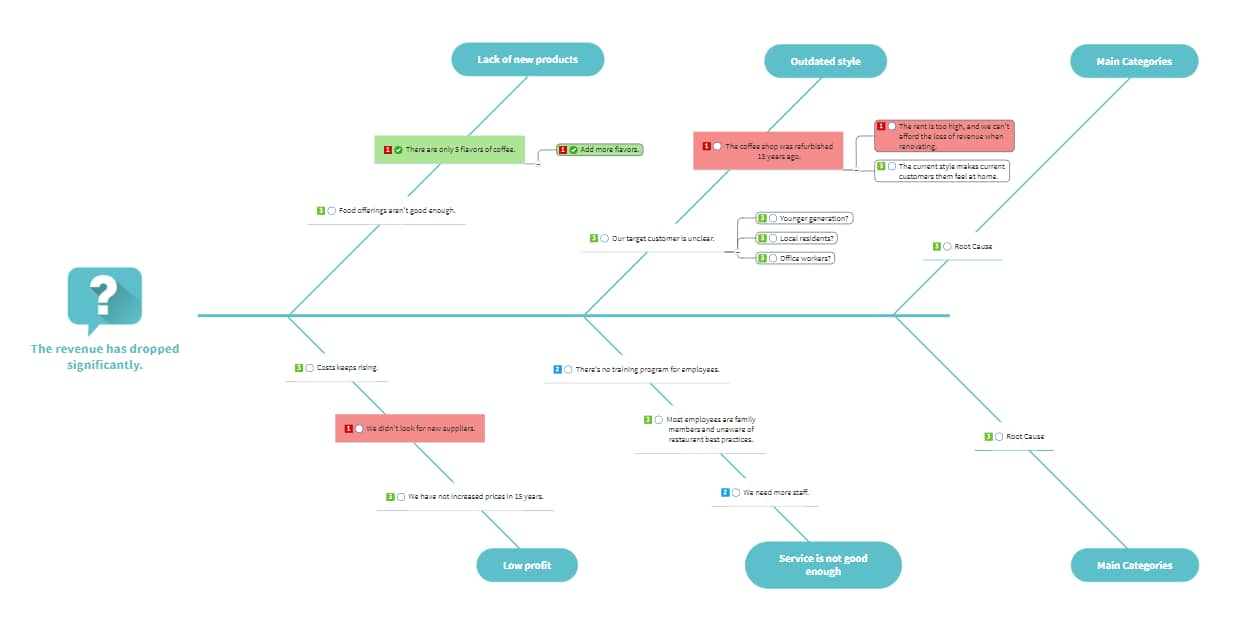
In product development projects, fishbone diagrams are useful for exploring market opportunities and identifying issues with current market offerings. To ensure your new products are truly filling a gap in the market, use a fishbone diagram to thoroughly explore your target customers' problems and the causes of those problems.
When a process or workflow isn't producing the desired outcomes, fishbone diagrams can help you diagnose the issues. When you do a deep dive into potential causes, it becomes easier to find the right solutions.
Fishbone diagrams provide a visual framework for root cause analysis and exploration. RCA methodology involves deeply investigating the underlying issues of problems that pop up, not just treating surface-level symptoms and putting out fires.
Fishbone diagrams help you visualize and explore the underlying causes of a particular problem. Top benefits of fishbone diagrams include:
The main benefit of a fishbone diagram is its ability to help you identify potential causes of a problem. With the different types of fishbone diagrams available, there is a layout to fit any type of business problem in any industry. You can use a diagram with predefined categories or assign your own categories to fit your needs.
With a fishbone diagram, you can ensure no stone remains unturned as you study the problem. As you explore potential causes, the fishbone diagram will reveal any areas of weakness or bottlenecks in your current processes. You'll be able to address these issues, and any other root causes you uncover along the way.
Most people are visual learners, and visual aids are proven to boost memory retention and recall. The visual format of the fishbone diagram accelerates the problem-solving process, helping you organize and categorize your thoughts and findings within a logical structure.
To get started making a fishbone diagram, follow these steps:
With a fishbone diagram software like MindManager, problem-solving and root cause analysis is changed forever—for the better. Features of MindManager include:
When you use MindManager as your fishbone diagram maker, you'll be able to quickly and easily record all the information you need, collaborate closely with your team, and gain a clearer perspective on the problem at hand and its potential causes.
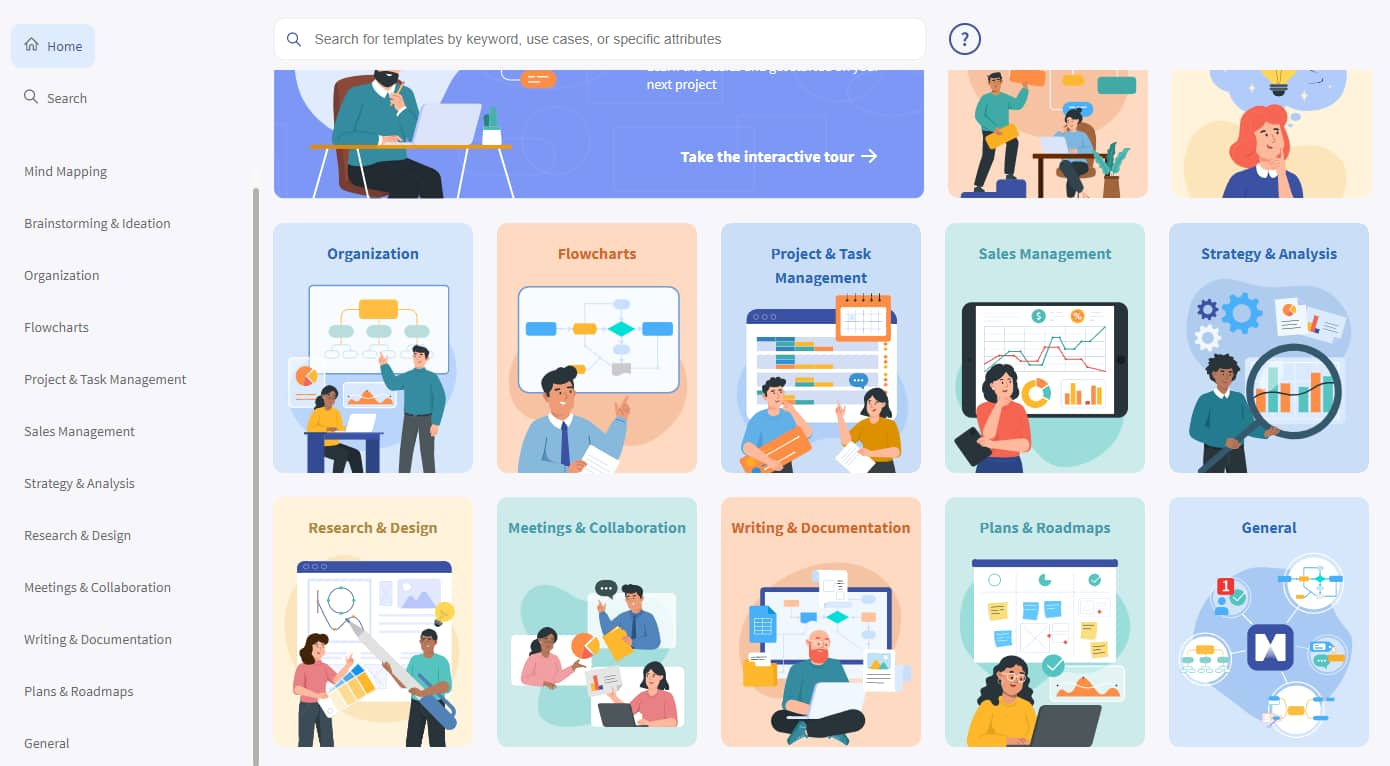
MindManager comes pre-installed with fishbone diagram templates. To use these templates:
Fishbone diagrams provide a visual framework for investigating the possible causes of a problem. They help you clearly sort ideas and explore various cause-and-effect connections within your business.
There are many different names for the fishbone diagram. Some of the most common include:
Fishbone diagrams provide a way to visually organize and examine the potential causes relating to a particular problem. There are multiple types of fishbone diagrams, and they're popular across various industries and functions, including manufacturing, service-based industries, and business administration.
With a fishbone diagram, you can more easily identify the causes of a problem, reveal areas of weakness in current business processes, and accelerate your problem-solving activities.
MindManager's fishbone diagram maker features a user-friendly interface, numerous premade templates, and an extensive library of images to support your diagram. To make a fishbone diagram, try MindManager today.