A tree diagram allows users to visualize possible outcomes and probabilities for a given situation. Tree diagrams, also called decision trees, are particularly useful in charting the outcomes of dependent events, where if one element changes, it impacts the entire outcome. Tracking and analyzing cause-and-effect scenarios is much easier when you have a visual aid such as a tree diagram.
In a tree diagram, each "branch" of the tree connects an idea or a step in the process to a possible outcome. Outcomes are commonly referred to as "nodes" on a tree diagram. The resulting diagram resembles a tree with many options and outcomes that branch off from the original idea.
Tree diagrams are versatile and useful for decision-making and other tasks across various fields and industries, including marketing, software development, logistics, project management, and more.
Tree diagrams are popular for brainstorming, problem-solving, and other idea-generation exercises. For more information about when to use a tree diagram, check out these examples:
Tree diagrams are designed to help you thoroughly explore the possible outcomes of different problems and scenarios. Marketing and UX professionals can use tree diagrams to explore user experience paths and the various possible outcomes along different customer journeys.
Tree diagrams are a helpful tool for problem-solving, including troubleshooting and root cause analysis. Software developers can use tree diagrams to analyze coding issues and find fixes during website and app development projects.
Before you launch a new process, product, or service, you can use a tree diagram to anticipate potential issues along the way. For example, supply chain managers can use tree diagrams to map out resource allocation and plans for a new product launch, exploring various options and identifying potential bottlenecks and roadblocks before beginning the project.
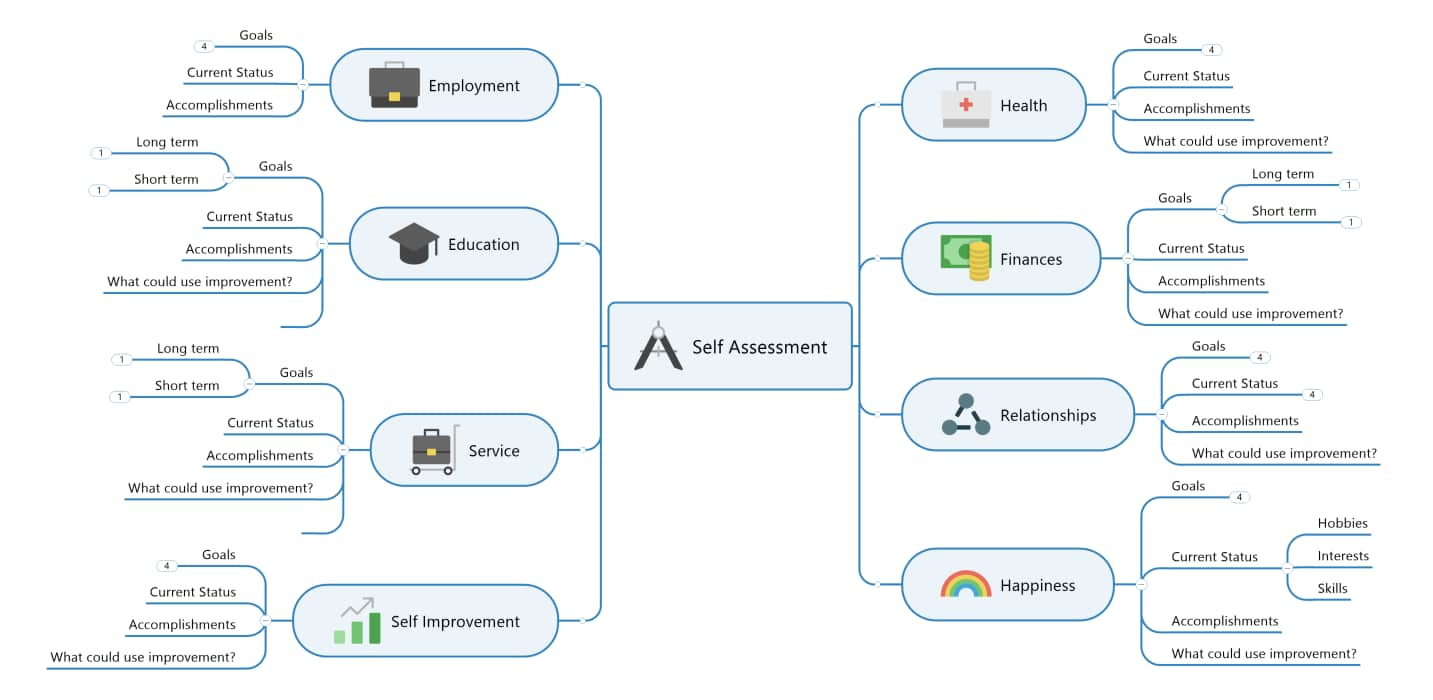
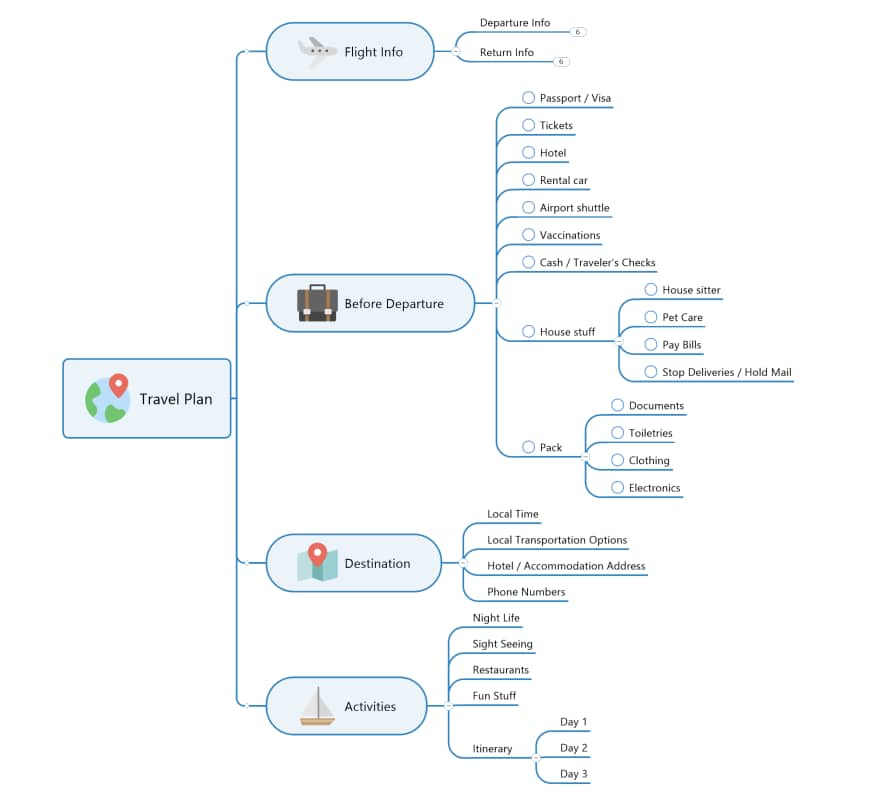
The tree diagram's hierarchical format is useful for project planning, especially when your project involves many different tasks and subtasks. Project managers can use a tree diagram to specify the task hierarchy for a project, helping project participants understand and agree upon each task's order and priority.
Tree diagrams help you explore potential outcomes in an organized, visual way. Some key benefits of tree diagrams include:
Tree diagrams provide a visual framework for decision-making, giving you an organized and systematic way to explore your options. This helps you gather and analyze all the data you need to make the best decision and get the best outcome.
The tree diagram format provides a visual aid for evaluating problems and trying different fixes. When you create a tree diagram for your problem and add a branch for each new idea as you troubleshoot, you're more likely to find a solution quickly and easily.
Tree diagrams make it easy to record and replicate workflows, helping you streamline processes and get your team on the same page about the best way to do certain tasks and projects. With your workflows documented and streamlined, your team will enjoy greater unity, harmony, and productivity.
Create a tree diagram by following these simple steps:
Using a tree diagram software like MindManager allows you to create a flexible, digital tree map that you can easily edit and share with your team. Key features and benefits of MindManager include:
Professionals across all types of industries and roles use MindManager to organize ideas, visualize complex concepts, and collaborate across departments. With MindManager, you can collaborate and communicate with your team in new and unexpected ways.
MindManager comes pre-installed with tree diagram templates. To use these templates:

One of the main types of tree diagrams is the cause and effect tree diagram, which is used to map potential outcomes for a given decision or situation. Other types of tree diagrams include:
Yes, a tree diagram is the same thing as a decision tree. Tree diagrams are sometimes referred to as decision trees because of how they help individuals map out different options and related outcomes.
Tree diagrams provide a visual framework for exploring the different possible outcomes for a problem, project, or workflow. Professionals across various industries use tree diagrams for brainstorming, decision making, problem-solving, troubleshooting, workflow management, and more.