A Program Evaluation and Review Technique (PERT) chart is a project management tool used to organize and schedule out tasks in a project, including dependencies between tasks. The U.S. Navy created PERT charts in the 1950s while developing the Polaris missile – the first U.S. submarine-launched ballistic missile (SLBM).
The purpose of a PERT chart is to help project managers to organize complex projects and estimate the minimum amount of time required to complete the entire project.
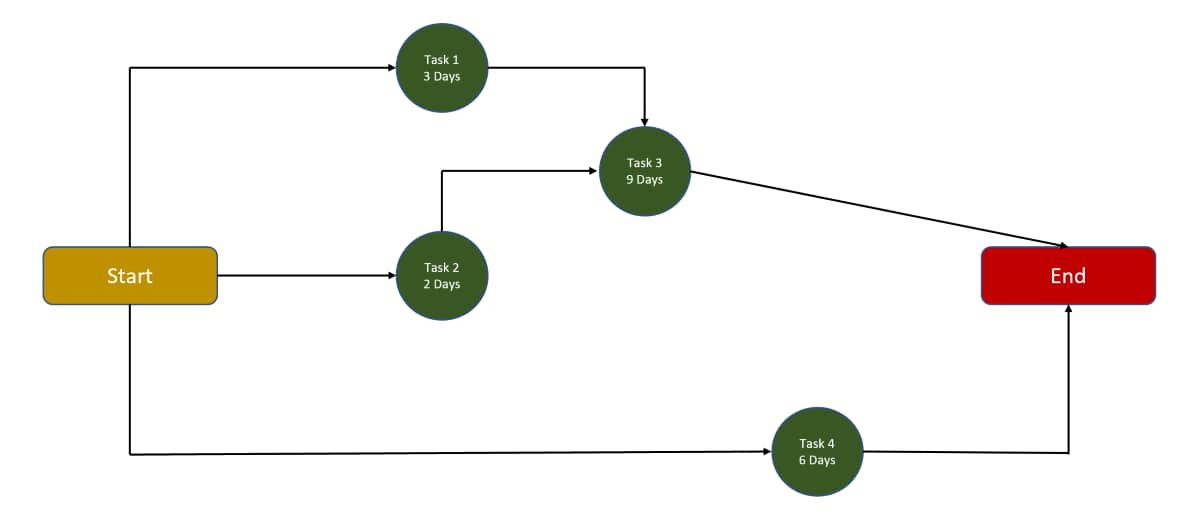
It typically uses circles and triangles, known as 'nodes,' to designate milestones and tasks within the project. It also uses lines, known as 'vectors,' to highlight the interdependence of tasks for completion.
 |
Terminator | Represents the start and end points of a chart. |
 |
Circular node | Represents events and milestones, and contains numbers to represent time requirements. |
 |
Rectangular node | Represents events and milestones, and contains numbers to represent time requirements. |
 |
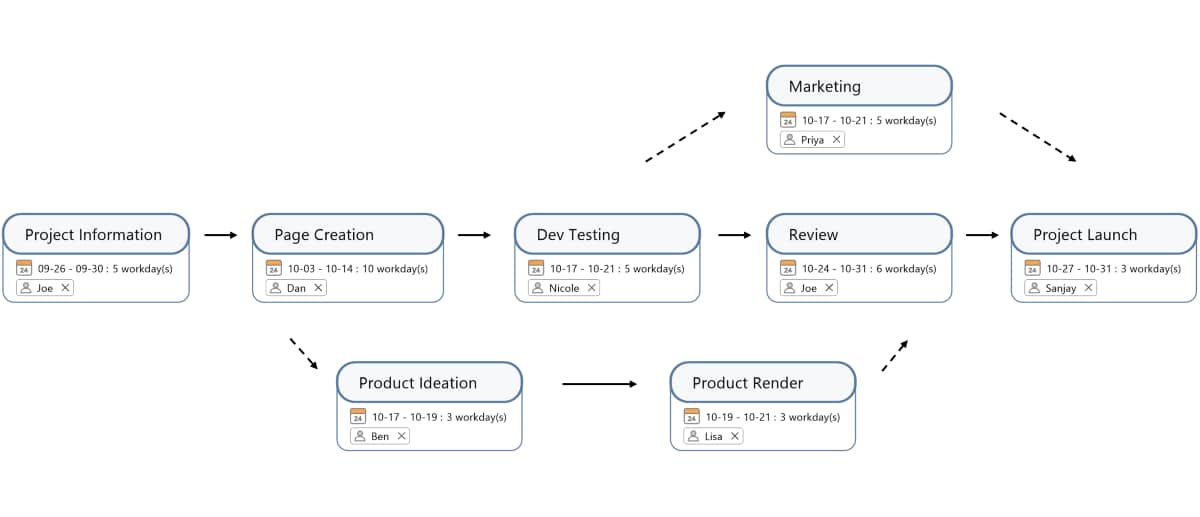
Task table | Shows time estimations, projected start and end dates, and task owners. |
 |
Line directional arrow connector | Depicts dependencies sequentially. |
 |
Dotted line directional arrow connector | Depicts dependencies that to not require resources. |
 |
Lanes/containers | Separates the chart into different zones which each represent different areas of the project. |
The purpose of a PERT chart is to visually show a project's path to completion in a way that is easy to communicate and digest. Here are some use cases for PERT charts:
PERT charts help teams visualize the tasks they need to complete and let them know whether they are on track. This helps project managers estimate how long it will take to complete a project and ensure they can meet project deadlines.
Project managers can use a PERT chart to estimate delivery and implementation dates based on the tasks' interactions and interdependencies. It also means that they can quickly identify bottlenecks and make appropriate adjustments where needed.
Project managers can use PERT charts to evaluate the time and resources needed to complete complex projects. This is helpful in developing a project budget. They can also share the PERT chart with their managers and other team members to demonstrate where the budget will be spent.
We have included a list of what makes PERT charts a good project management tool:
PERT charts allow project managers to organize tasks for large-scale projects in a simpler and easier-to-understand manner. This will enable managers to communicate which team member is responsible for what task clearly.
PERT charts help to facilitate the understanding of what needs to be completed within an organization. This helps project managers organize a large-scale project's tasks in a way that is easy to understand. If anyone within the team is unsure about what task they should be completing or what milestone they should focus on, they can quickly refer to the chart for guidance.
PERT charts provide a framework of time estimations for the delivery of different parts of a project and help organizations to set milestones for important projects. This makes it easier for teams to focus on the most critical items for a business project and helps them to evaluate and adjust resource distribution.
Evaluating resource distribution among project groups is straightforward with PERT charts. Project managers can determine the time and resources groups will need to perform a given activity. Because it's possible to visualize the complexity of a project in this type of chart, it's easier to see what resources are needed for each.
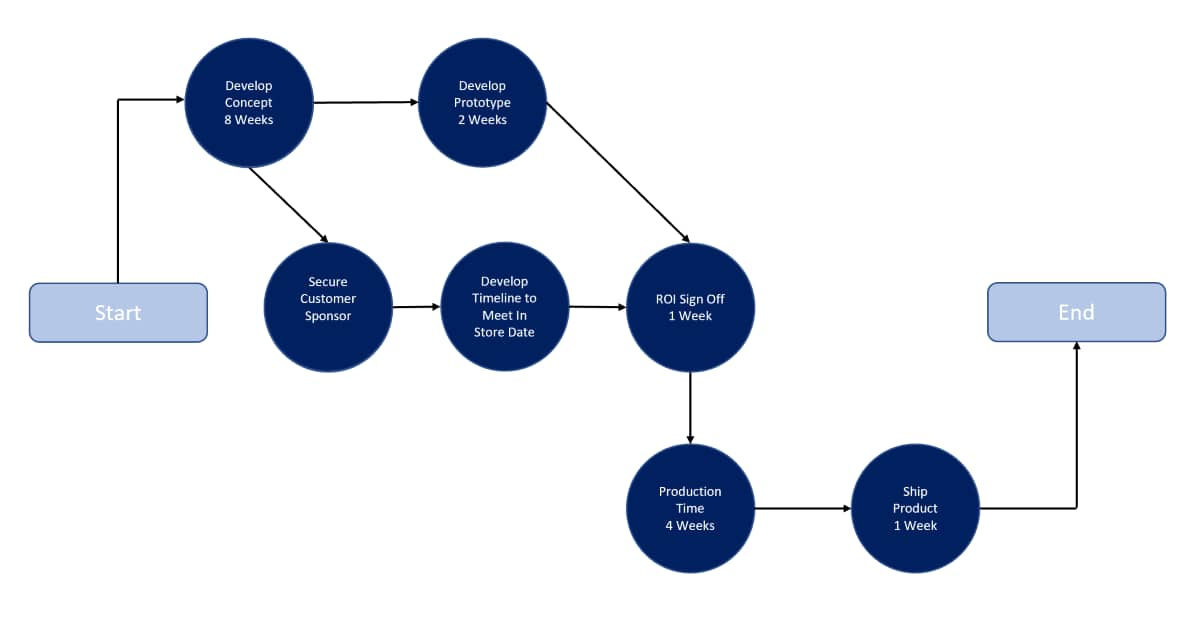
Creating a visual timeline of a project enables managers to break down the tasks they need completed and create a schedule. Visualizing a timeline establishes a starting point for determining the necessary steps projects must take from beginning to end.
PERT charts provide project managers and teams with a transparent view of the potential scenarios associated with the completion of the project. It identifies the critical path – the minimum amount of time needed to complete the operation – and other subcritical paths. Project managers can analyze any of these paths to determine how much time they have available until completion.
Project managers can view a framework for different levels of estimates for business implementation and delivery. This provides a sense of when the project is scheduled to be completed and when it'll be ready for implementation. This visualization allows project managers to communicate delivery times clearly.
You can create a PERT chart on a whiteboard or a piece of paper, or you can download software to make the process easier. Whether you're creating it by hand or using software, we have included a list of steps to help you create a PERT chart that you can adapt to your project's needs:
You can draw a PERT chart by hand or use PERT chart software designed specifically for creating visualizations. MindManager is the software that helps you create PERT charts that helps you to visualize complex projects and improve your team's resource distribution.
MindManager is an industry-leading collaborative concept mapping software with many features and benefits, including:
MindManager comes pre-installed with many templates. To use these templates:
A PERT chart is designed to show a graphical representation of a project timeline so that team members can easily visualize tasks and see the dependencies between them.
A typical PERT chart contains two key elements:
PERT charts are typically created before a project begins. They help project managers to plan tasks and determine the duration of each task.
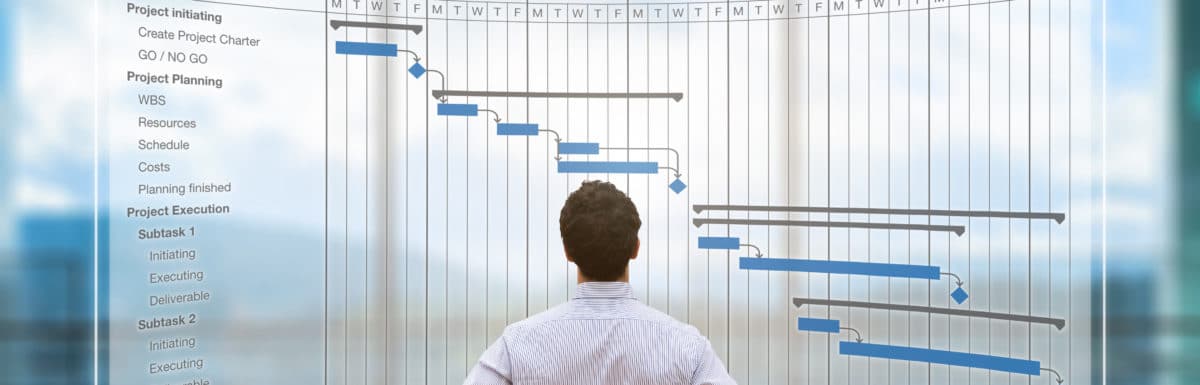
On the other hand, Gantt charts are typically created while a project is happening. They help project managers to break down large tasks into smaller tasks and identify scheduling constraints.
Project managers use PERT charts to organize and schedule project tasks and outline dependencies between tasks. They are typically used to meet project deadlines, display task interdependencies, and organize complex projects. They do this by helping teams to focus on the most critical items for a project and helping them to understand what needs to be completed within a specific timeframe.
Ready to build a PERT chart? Try MindManager for free for 30 days and start building your own PERT charts right away with premade, customizable templates.